KinderCare IPO Presentation Deck
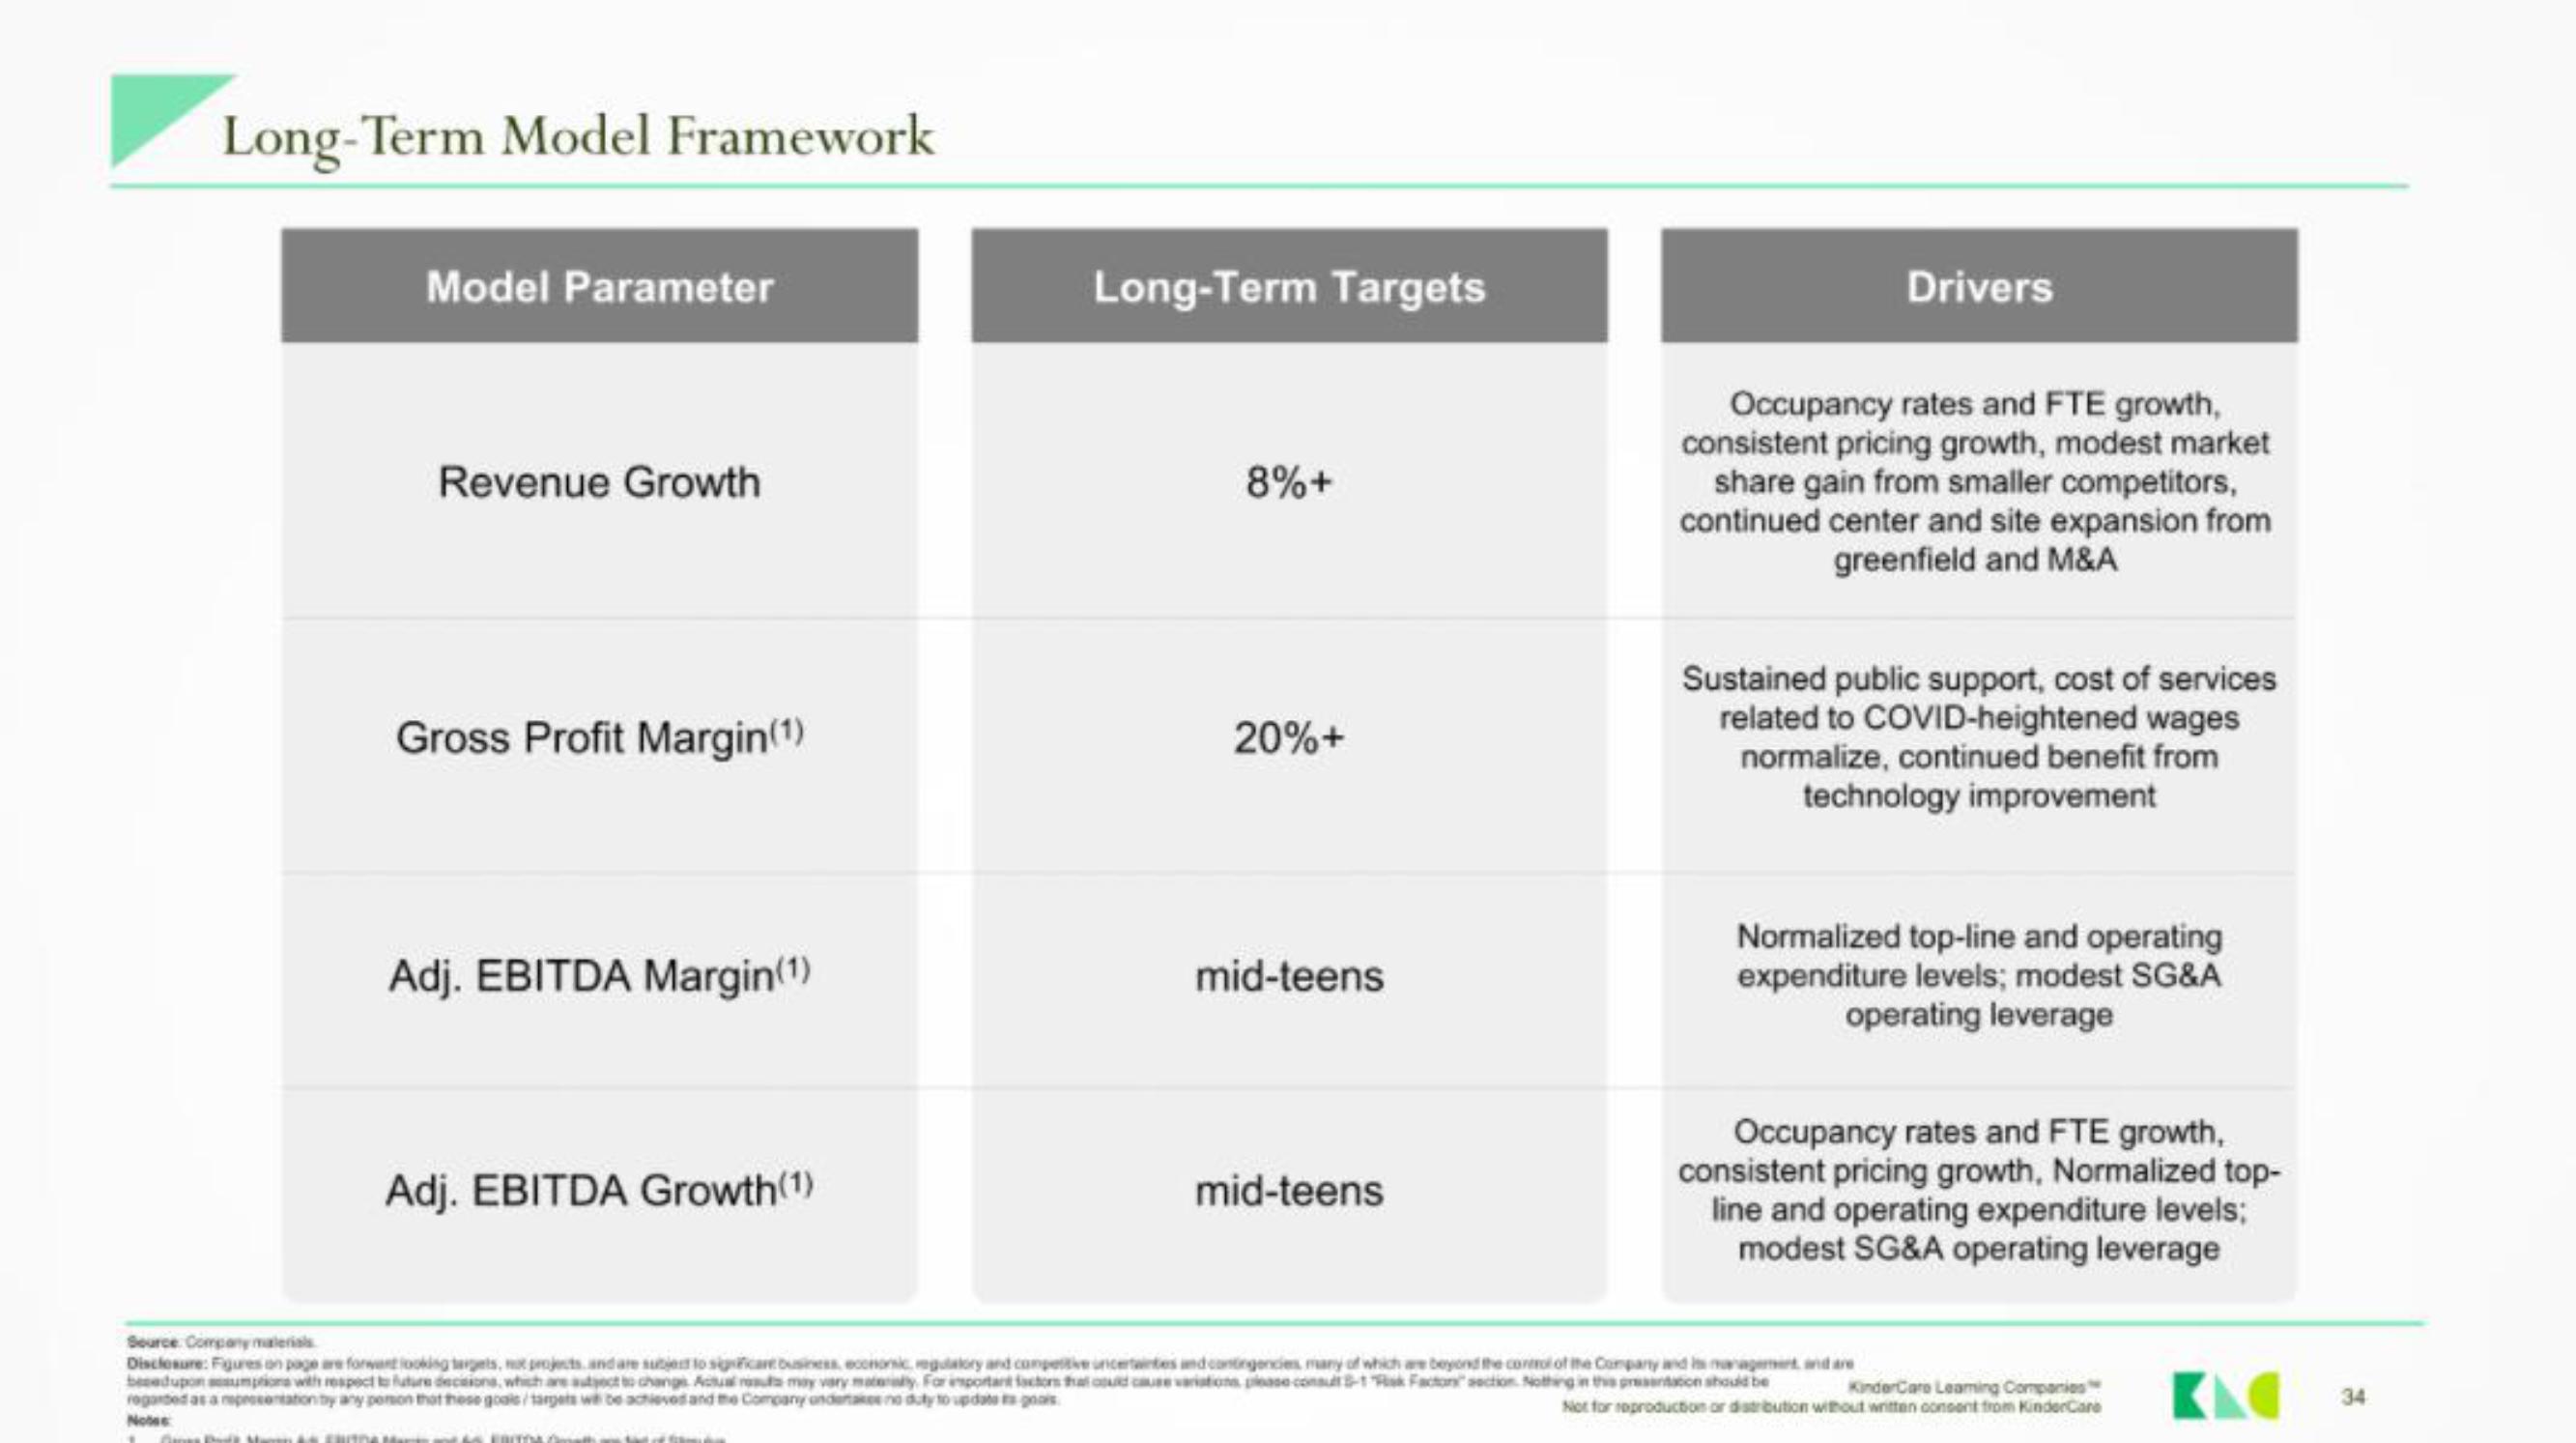
Long-Term Model Framework
Model Parameter
Revenue Growth
Gross Profit Margin(¹)
Adj. EBITDA Margin(¹)
Adj. EBITDA Growth(1)
Long-Term Targets
EBITDA math
8%+
20%+
mid-teens
mid-teens
Drivers
Occupancy rates and FTE growth,
consistent pricing growth, modest market
share gain from smaller competitors,
continued center and site expansion from
greenfield and M&A
Sustained public support, cost of services
related to COVID-heightened wages
normalize, continued benefit from
technology improvement
Normalized top-line and operating
expenditure levels; modest SG&A
operating leverage
Occupancy rates and FTE growth,
consistent pricing growth, Normalized top-
line and operating expenditure levels;
modest SG&A operating leverage
Source Company materials
Disclosure: Figures on page are forwart looking targets, not projects, and are subject to significant business, economic, regulatory and competitive uncertainties and contingencies, many of which are beyond the control of the Company and in management, and are
beadupon assumptions with respect to future decisions, which are subject to change Actual rus may vary materially. For important factors that could cause variations, please consult-1 Rak Facton" section. Nothing in this presentation should be
KinderCare Leaming Companies
regarded as a representation by any person that these goals/targets we be achieved and the Company undertakes no duty to update gas
Not for reproduction or distribution without written consent from KinderCare
Note:
34View entire presentation