Crocs Investor Presentation Deck
NON-GAAP RECONCILIATION
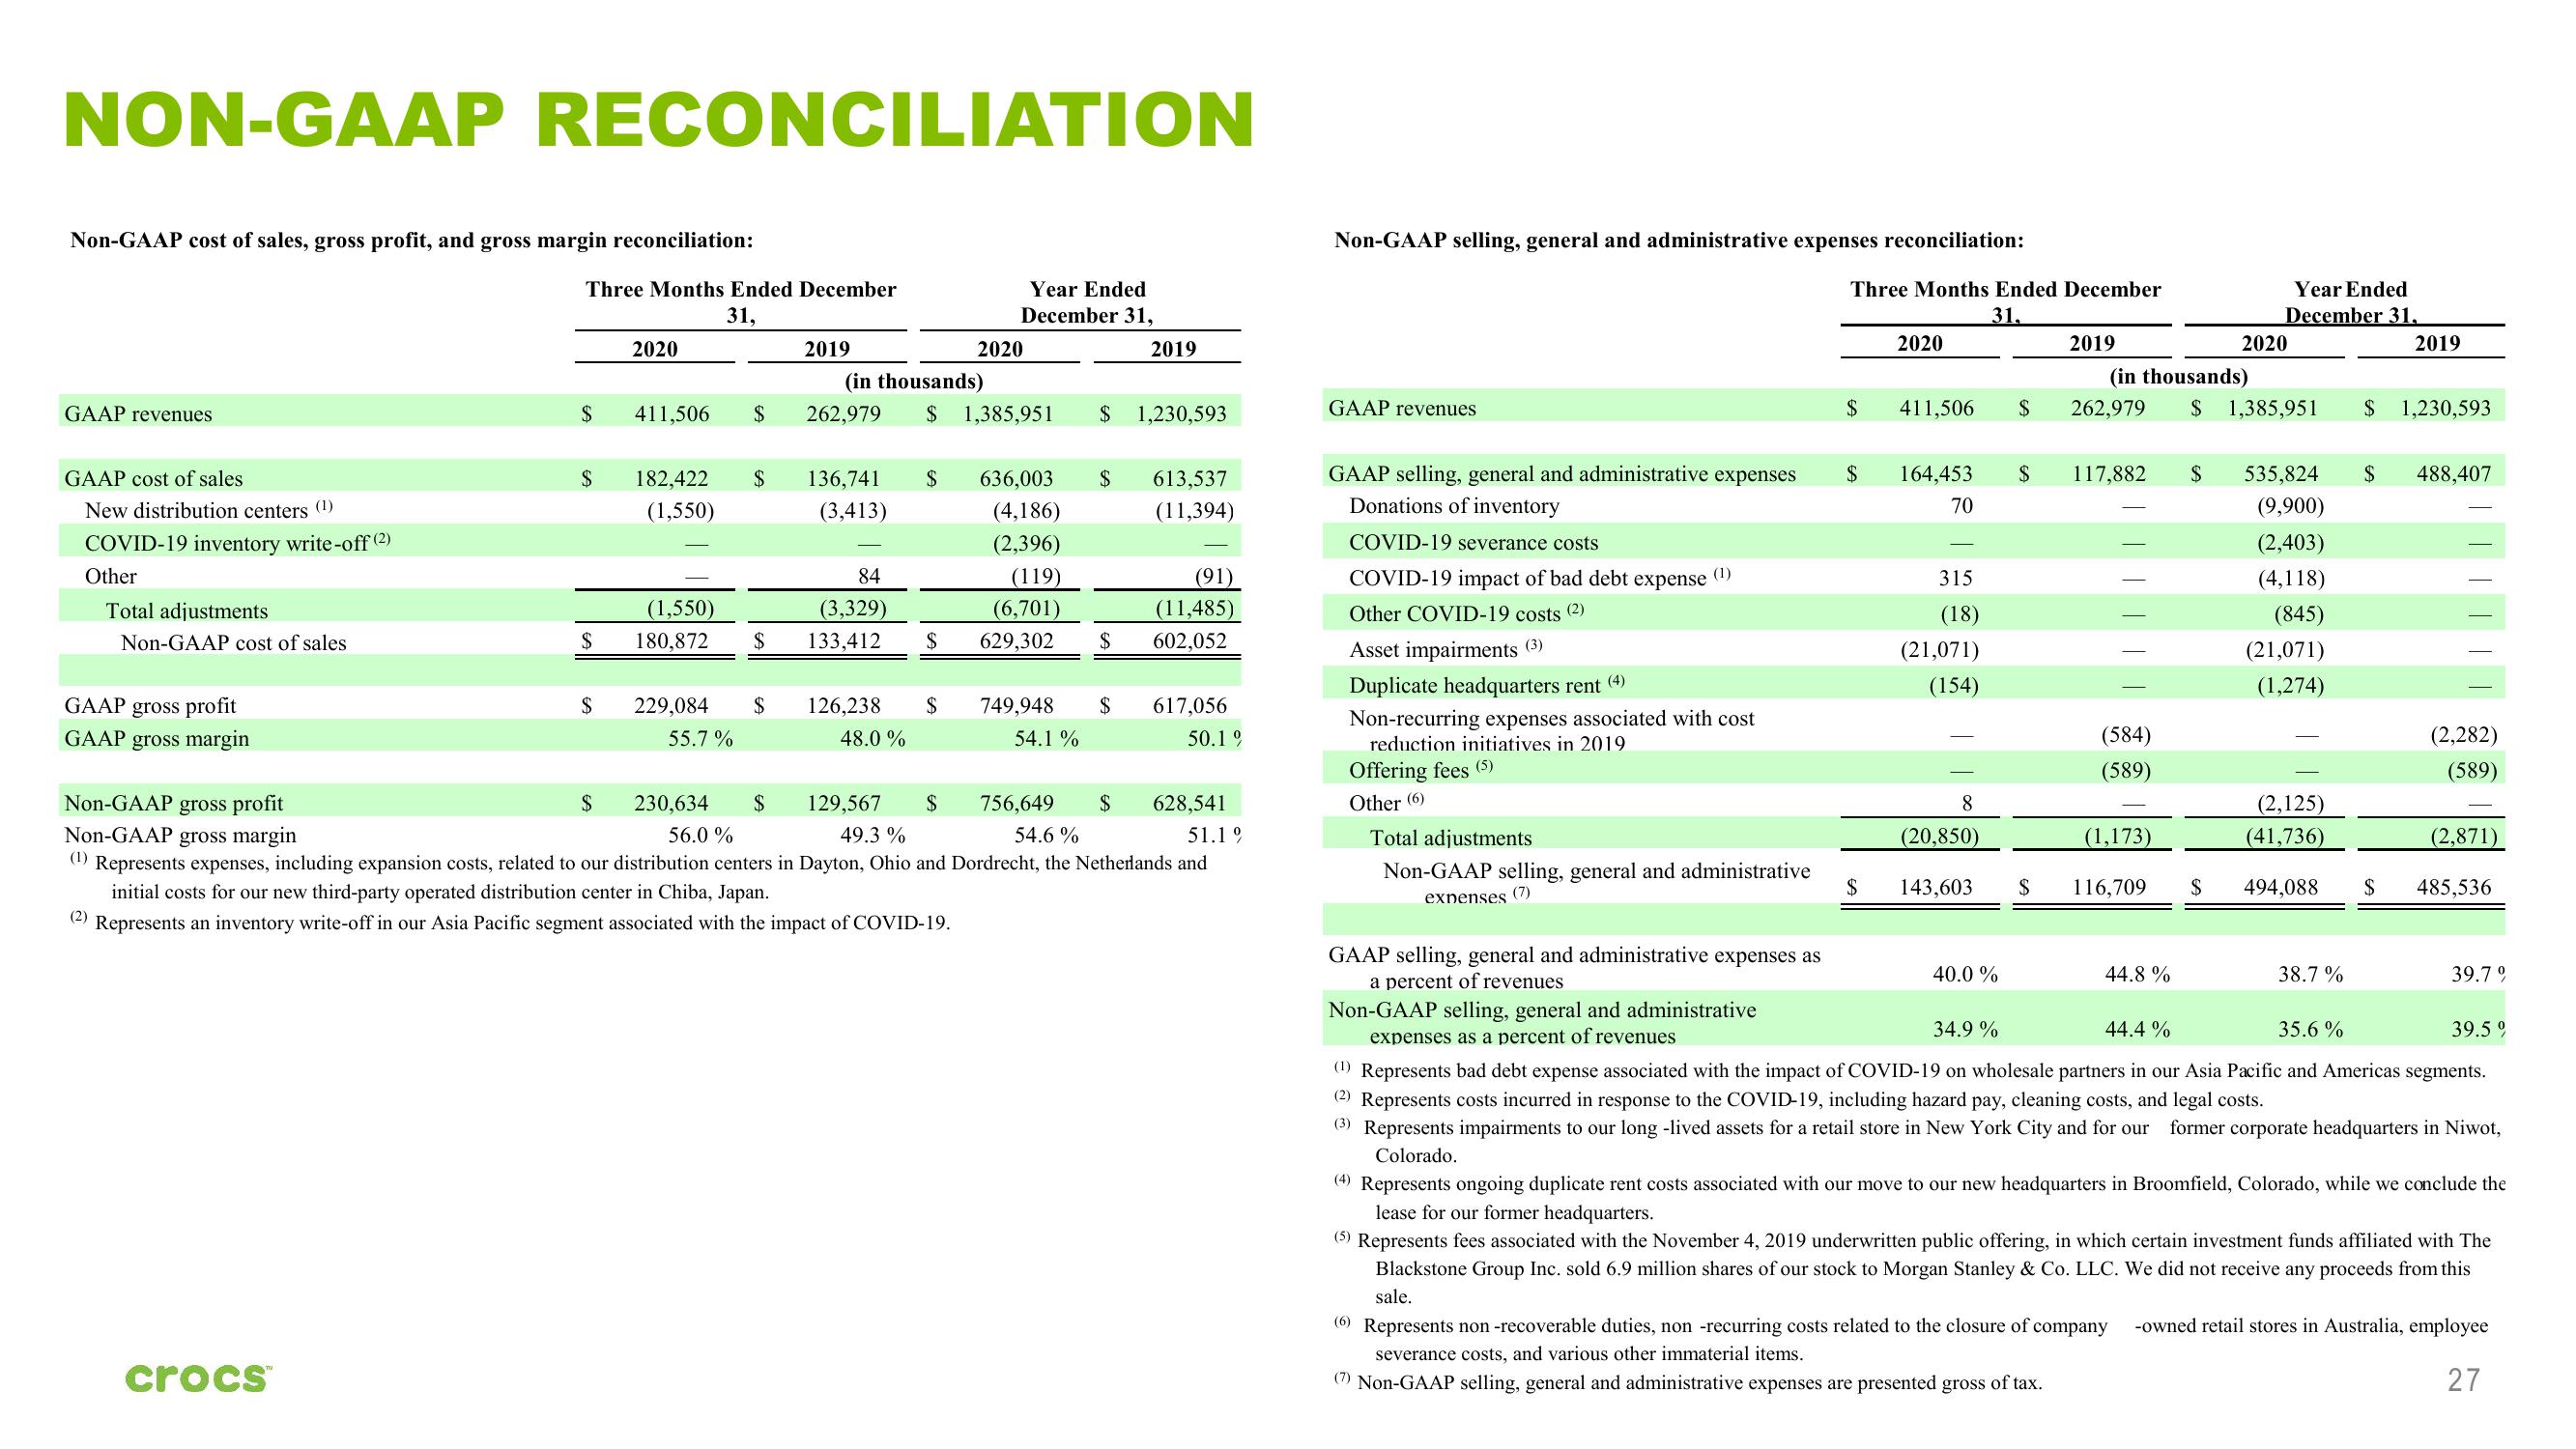
Non-GAAP cost of sales, gross profit, and gross margin reconciliation:
GAAP revenues
GAAP cost of sales
New distribution centers (1)
COVID-19 inventory write-off (2)
Other
Total adjustments
Non-GAAP cost of sales
GAAP gross profit
GAAP gross margin
Non-GAAP gross profit
Non-GAAP gross margin
(2)
Three Months Ended December
31,
crocs™
$
$
$
2020
$
411,506
182,422
(1,550)
$
(1,550)
$ 180,872 $
$
229,084 $
55.7%
2019
(in thousands)
262,979 $ 1,385,951
136,741
(3,413)
Year Ended
December 31,
84
(3,329)
133,412 $
$ 636,003
(4,186)
(2,396)
(119)
(6,701)
629,302
126,238 $
48.0 %
2020
749,948
54.1 %
$ 1,230,593
$
$
2019
$
613,537
(11,394)
230,634 $
56.0 %
129,567 $
49.3 %
756,649 $
54.6%
51.19
(1) Represents expenses, including expansion costs, related to our distribution centers in Dayton, Ohio and Dordrecht, the Netherlands and
initial costs for our new third-party operated distribution center in Chiba, Japan.
Represents an inventory write-off in our Asia Pacific segment associated with the impact of COVID-19.
(91)
(11,485)
602,052
617,056
50.1 %
628,541
Non-GAAP selling, general and administrative expenses reconciliation:
GAAP revenues
GAAP selling, general and administrative expenses
Donations of inventory
COVID-19 severance costs
COVID-19 impact of bad debt expense (1)
Other COVID-19 costs (2)
Asset impairments (3)
(4)
Duplicate headquarters rent
Non-recurring expenses associated with cost
reduction initiatives in 2019
Offering fees (5)
Other (6)
Total adjustments
GAAP selling, general and administrative expenses as
a percent of revenues
Non-GAAP selling, general and administrative
expenses (7)
Non-GAAP selling, general and administrative
expenses as a percent of revenues
(5)
(6)
Three Months Ended December
31,
$
$
$
2020
411,506
164,453
70
315
(18)
(21,071)
(154)
8
(20,850)
143,603
40.0 %
$
$
$
117,882 $
2019
(in thousands)
262,979 $ 1,385,951
(584)
(589)
(1,173)
116,709
44.8%
Year Ended
December 31.
2019
2020
Represents non-recoverable duties, non -recurring costs related to the closure of company
severance costs, and various other immaterial items.
(7) Non-GAAP selling, general and administrative expenses are presented gross of tax.
535,824
(9,900)
(2,403)
(4,118)
(845)
(21,071)
(1,274)
$ 1,230,593
38.7%
$ 488,407
(2,125)
(41,736)
$ 494,088 $
(2,282)
(589)
34.9%
44.4%
35.6%
39.5 9
(¹) Represents bad debt expense associated with the impact of COVID-19 on wholesale partners in our Asia Pacific and Americas segments.
(2) Represents costs incurred in response to the COVID-19, including hazard pay, cleaning costs, and legal costs.
(3) Represents impairments to our long -lived assets for a retail store in New York City and for our former corporate headquarters in Niwot,
Colorado.
(2,871)
485,536
(4) Represents ongoing duplicate rent costs associated with our move to our new headquarters in Broomfield, Colorado, while we conclude the
lease for our former headquarters.
Represents fees associated with the November 4, 2019 underwritten public offering, in which certain investment funds affiliated with The
Blackstone Group Inc. sold 6.9 million shares of our stock to Morgan Stanley & Co. LLC. We did not receive any proceeds from this
sale.
-owned retail stores in Australia, employee
27
39.79View entire presentation