OpenText Investor Presentation Deck
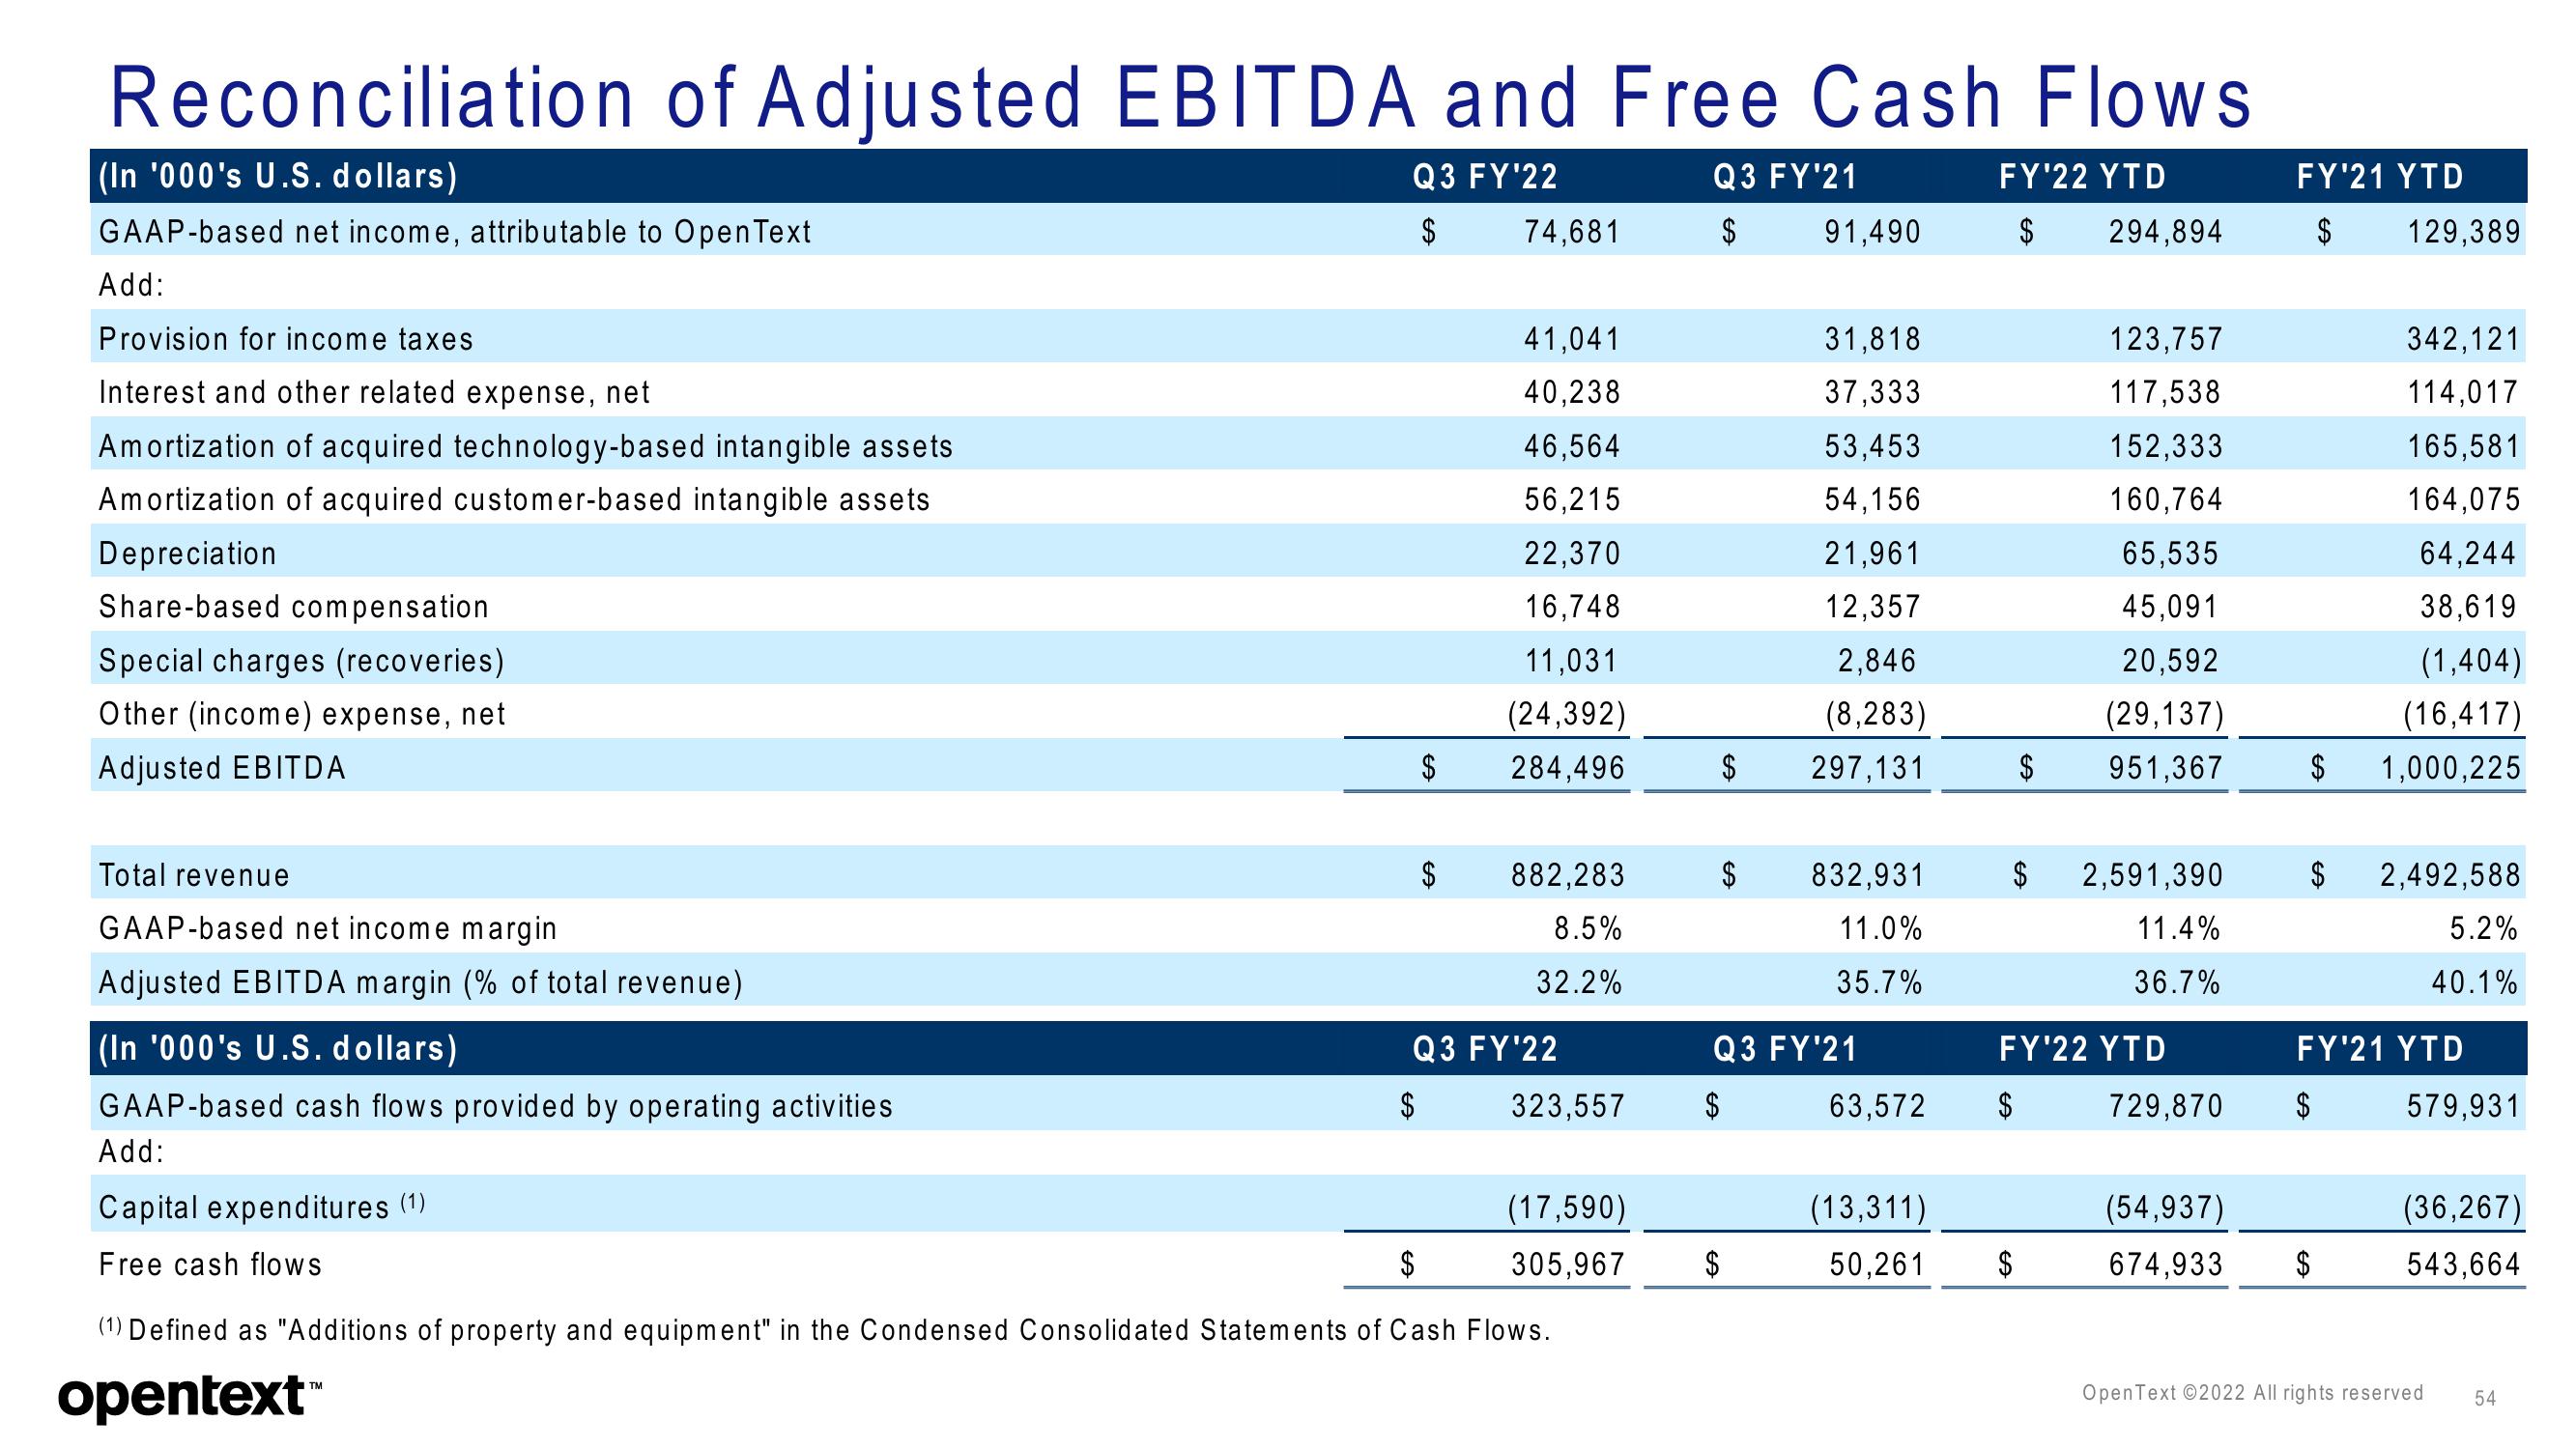
Reconciliation of Adjusted EBITDA and Free Cash Flows
(In '000's U.S. dollars)
Q3 FY'22
Q3 FY'21
FY'22 YTD
GAAP-based net income, attributable to Open Text
$
$
$ 294,894
Add:
Provision for income taxes
Interest and other related expense, net
Amortization of acquired technology-based intangible assets
Amortization of acquired customer-based intangible assets
Depreciation
Share-based compensation
Special charges (recoveries)
Other (income) expense, net
Adjusted EBITDA
Total revenue
GAAP-based net income margin
Adjusted EBITDA margin (% of total revenue)
(In '000's U.S. dollars)
GAAP-based cash flows provided by operating activities
Add:
Capital expenditures (¹)
Free cash flows
$
$
74,681
41,041
40,238
46,564
56,215
22,370
16,748
11,031
(24,392)
284,496
882,283
8.5%
32.2%
Q3 FY'22
323,557
(17,590)
305,967
(1) Defined as "Additions of property and equipment" in the Condensed Consolidated Statements of Cash Flows.
opentext™
$
91,490
$
31,818
37,333
53,453
54,156
21,961
12,357
2,846
(8,283)
297,131
832,931
11.0%
35.7%
Q3 FY'21
63,572
$
123,757
117,538
152,333
160,764
65,535
45,091
20,592
(29,137)
951,367
$ 2,591,390
11.4%
36.7%
(13,311)
50,261 $
FY'22 YTD
$
729,870
(54,937)
674,933
FY'21 YTD
$ 129,389
342,121
114,017
165,581
164,075
64,244
38,619
(1,404)
(16,417)
$ 1,000,225
$ 2,492,588
5.2%
40.1%
FY'21 YTD
$
$
579,931
(36,267)
543,664
OpenText ©2022 All rights reserved
54View entire presentation