Bank of America Results Presentation Deck
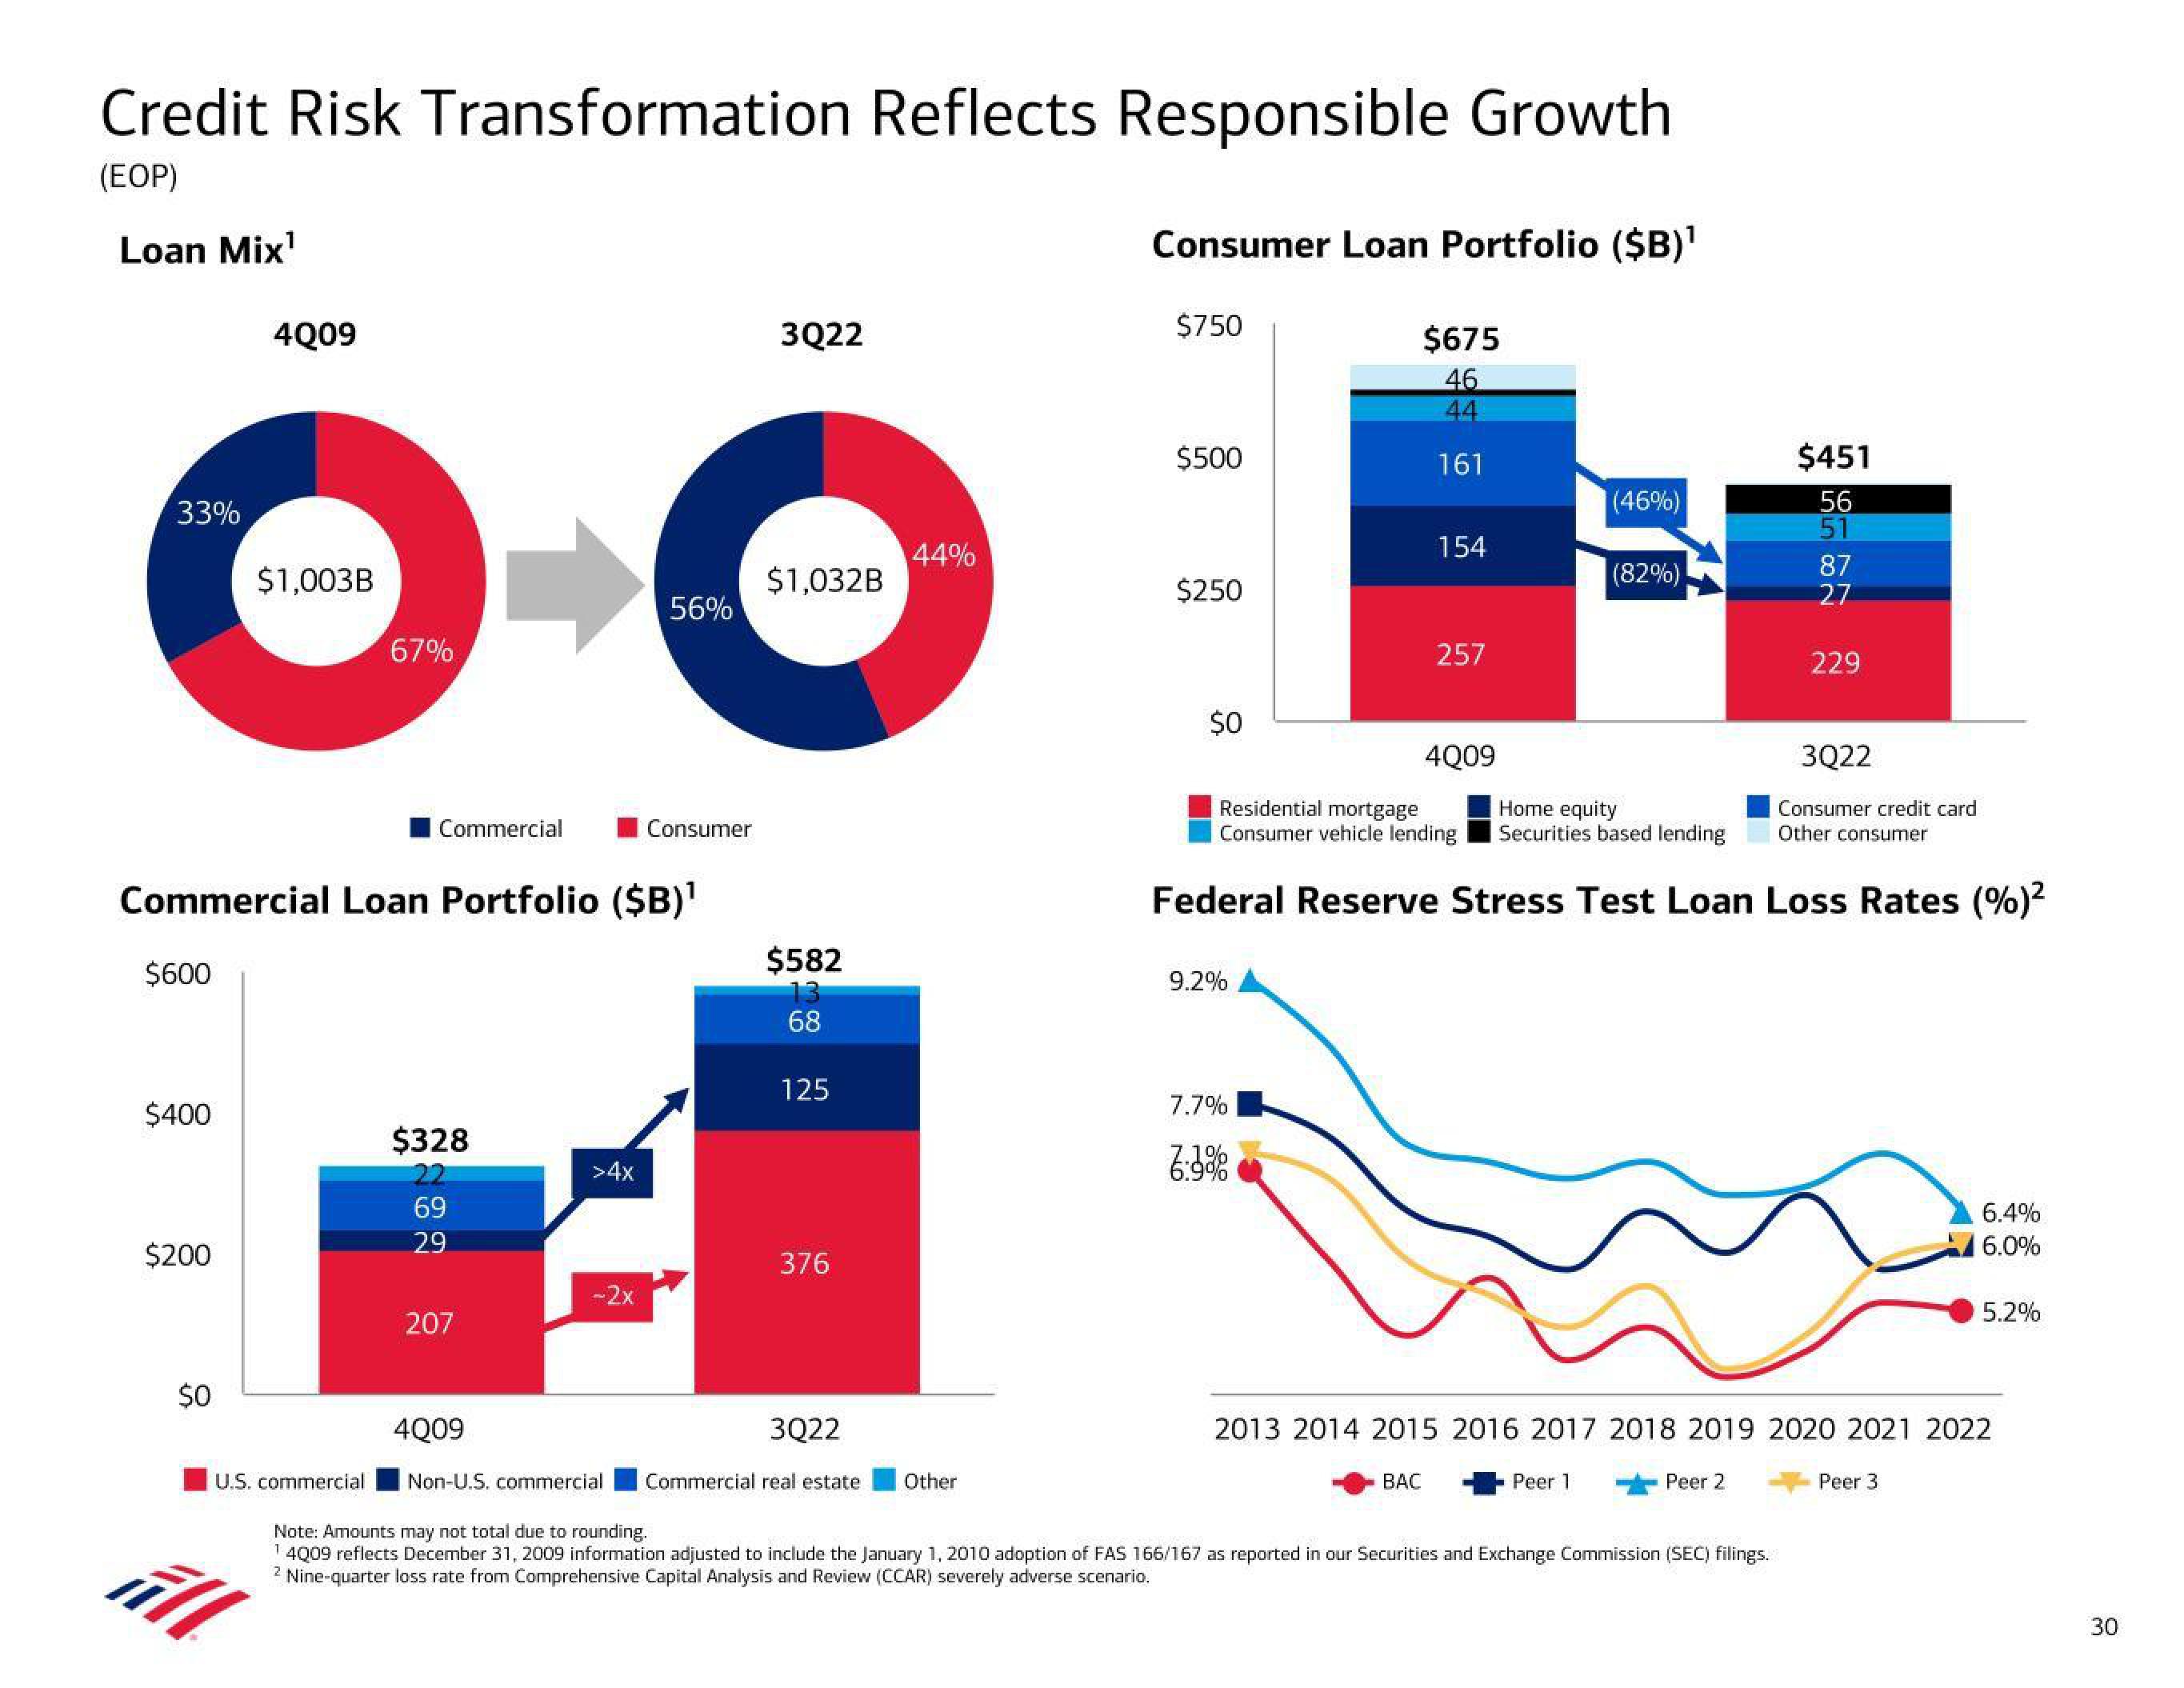
Credit Risk Transformation Reflects Responsible Growth
(EOP)
Loan Mix¹
33%
$600
$400
$200
4Q09
$0
$1,003B
Commercial Loan Portfolio ($B)¹
67%
Commercial
U.S. commercial
$328
22
69
29
207
>4x
56%
-2x
Consumer
3Q22
$1,032B
$582
13
68
125
376
3Q22
44%
Commercial real estate
Consumer Loan Portfolio ($B)¹
Other
$750
$500
$250
$0
9.2%
$675
46
44
161
7.7%
154
7:3%
257
Residential mortgage
Consumer vehicle lending
4Q09
4Q09
Non-U.S. commercial
Note: Amounts may not total due to rounding.
¹4009 reflects December 31, 2009 information adjusted to include the January 1, 2010 adoption of FAS 166/167 as reported in our Securities and Exchange Commission (SEC) filings.
2 Nine-quarter loss rate from Comprehensive Capital Analysis and Review (CCAR) severely adverse scenario.
(46%)
(82%)
Home equity
Securities based lending
Federal Reserve Stress Test Loan Loss Rates (%)²
Peer 1
$451
56
87
27
Peer 2
229
3Q22
Consumer credit card
Other consumer
2013 2014 2015 2016 2017 2018 2019 2020 2021 2022
BAC
6.4%
6.0%
Peer 3
5.2%
30View entire presentation