Apollo Global Management Investor Presentation Deck
Investment Records as of December 31, 2020 - Continued
3.
4.
5.
6.
7.
8.
9.
($ in millions)
Credit:
MidCap⁹
AIF
AFT
10.
AINV/Other 10
Real Assets:
ARI
Total
IPO Year³
N/A
2013
2011
2004
2009
Permanent Capital Vehicles
APOLLO
Total AUM
$8,142
345
373
4,446
6,930
$20,236
4Q'20
2%
17
15
33
28%
FY'20
Total Returns7
6%
4
3
(27)
(29%)
4Q'19
4%
2
4
11
1.
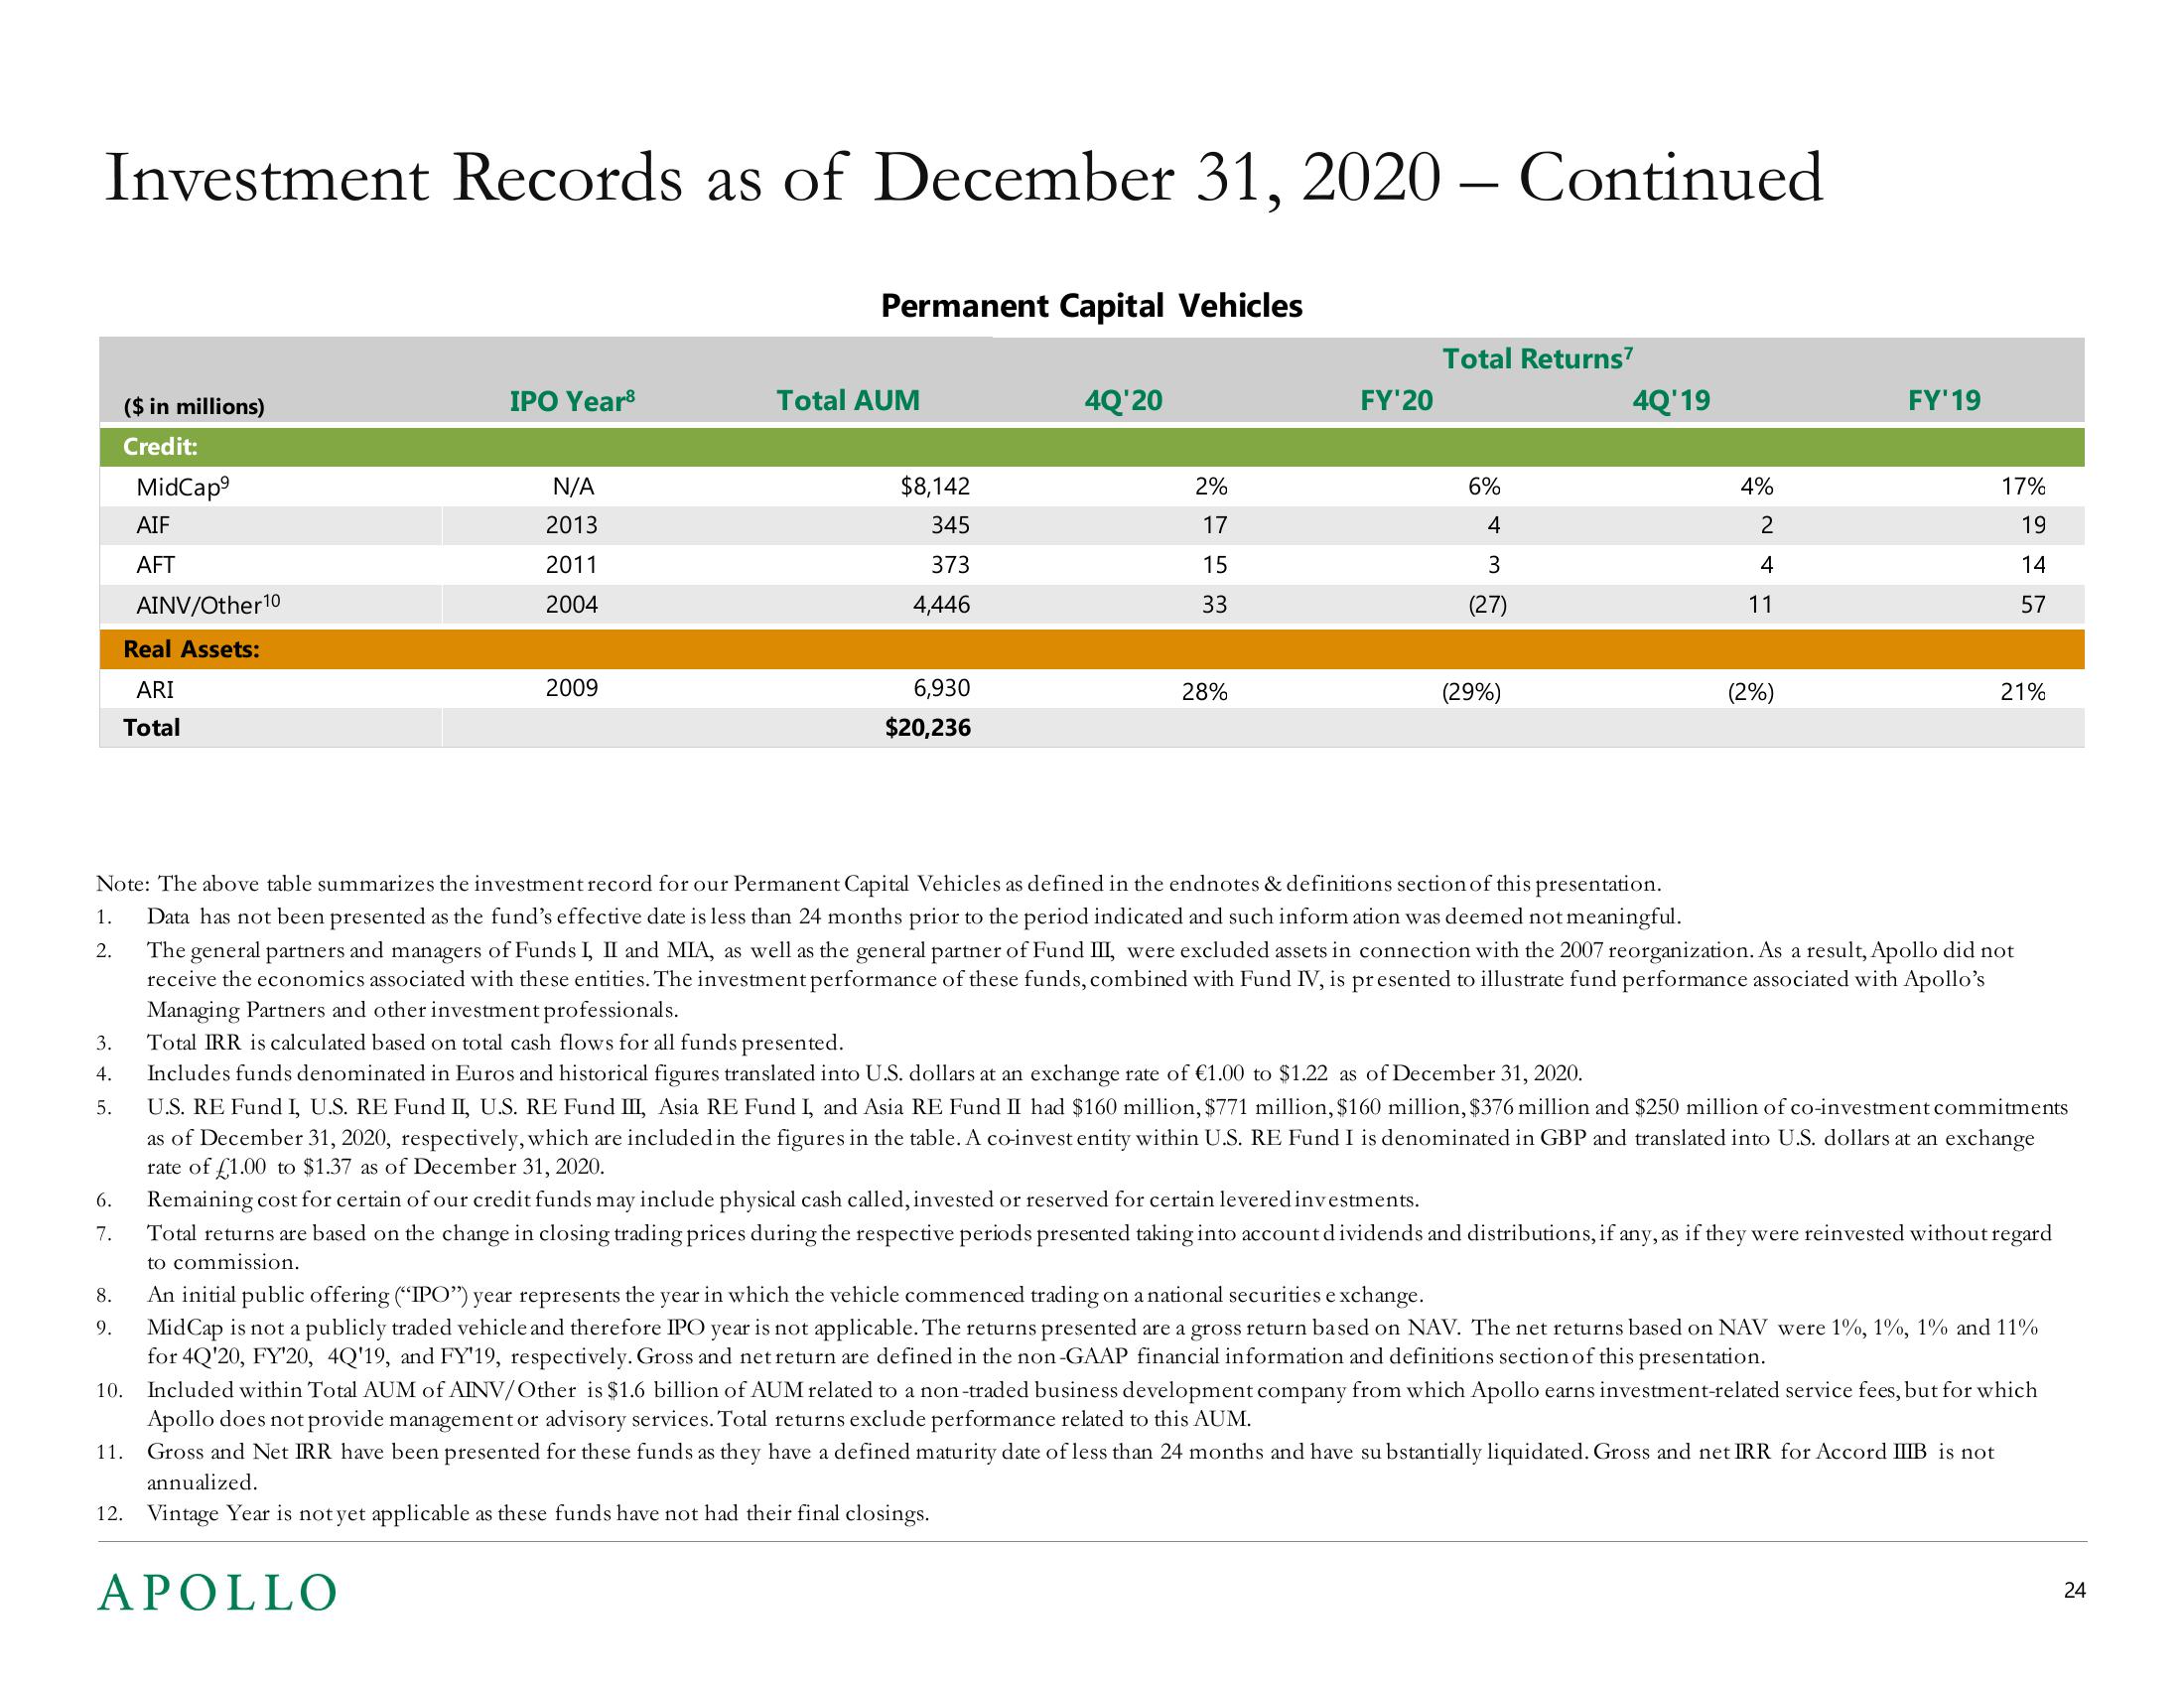
Note: The above table summarizes the investment record for our Permanent Capital Vehicles as defined in the endnotes & definitions section of this presentation.
Data has not been presented as the fund's effective date is less than 24 months prior to the period indicated and such information was deemed not meaningful.
The general partners and managers of Funds I, II and MIA, as well as the general partner of Fund III, were excluded assets in connection with the 2007 reorganization. As a result, Apollo did not
receive the economics associated with these entities. The investment performance of these funds, combined with Fund IV, is presented to illustrate fund performance associated with Apollo's
Managing Partners and other investment professionals.
2.
Total IRR is calculated based on total cash flows for all funds presented.
Includes funds denominated in Euros and historical figures translated into U.S. dollars at an exchange rate of €1.00 to $1.22 as of December 31, 2020.
(2%)
FY' 19
17%
19
14
57
21%
U.S. RE Fund I, U.S. RE Fund II, U.S. RE Fund III, Asia RE Fund I, and Asia RE Fund II had $160 million, $771 million, $160 million, $376 million and $250 million of co-investment commitments
as of December 31, 2020, respectively, which are included in the figures in the table. A co-invest entity within U.S. RE Fund I is denominated in GBP and translated into U.S. dollars at an exchange
rate of £1.00 to $1.37 as of December 31, 2020.
Remaining cost for certain of our credit funds may include physical cash called, invested or reserved for certain levered investments.
Total returns are based on the change in closing trading prices during the respective periods presented taking into account dividends and distributions, if any, as if they were reinvested without regard
to commission.
An initial public offering ("IPO") year represents the year in which the vehicle commenced trading on a national securities exchange.
Mid Cap is not a publicly traded vehicle and therefore IPO year is not applicable. The returns presented are a gross return based on NAV. The net returns based on NAV were 1%, 1%, 1% and 11%
for 4Q'20, FY'20, 4Q'19, and FY'19, respectively. Gross and net return are defined in the non-GAAP financial information and definitions section of this presentation.
Included within Total AUM of AINV/Other is $1.6 billion of AUM related to a non-traded business development company from which Apollo earns investment-related service fees, but for which
Apollo does not provide management or advisory services. Total returns exclude performance related to this AUM.
11. Gross and Net IRR have been presented for these funds as they have a defined maturity date of less than 24 months and have substantially liquidated. Gross and net IRR for Accord IIIB is not
annualized.
12. Vintage Year is not yet applicable as these funds have not had their final closings.
24View entire presentation