BuzzFeed SPAC Presentation Deck
BuzzFeed
41%
(1)
(2)
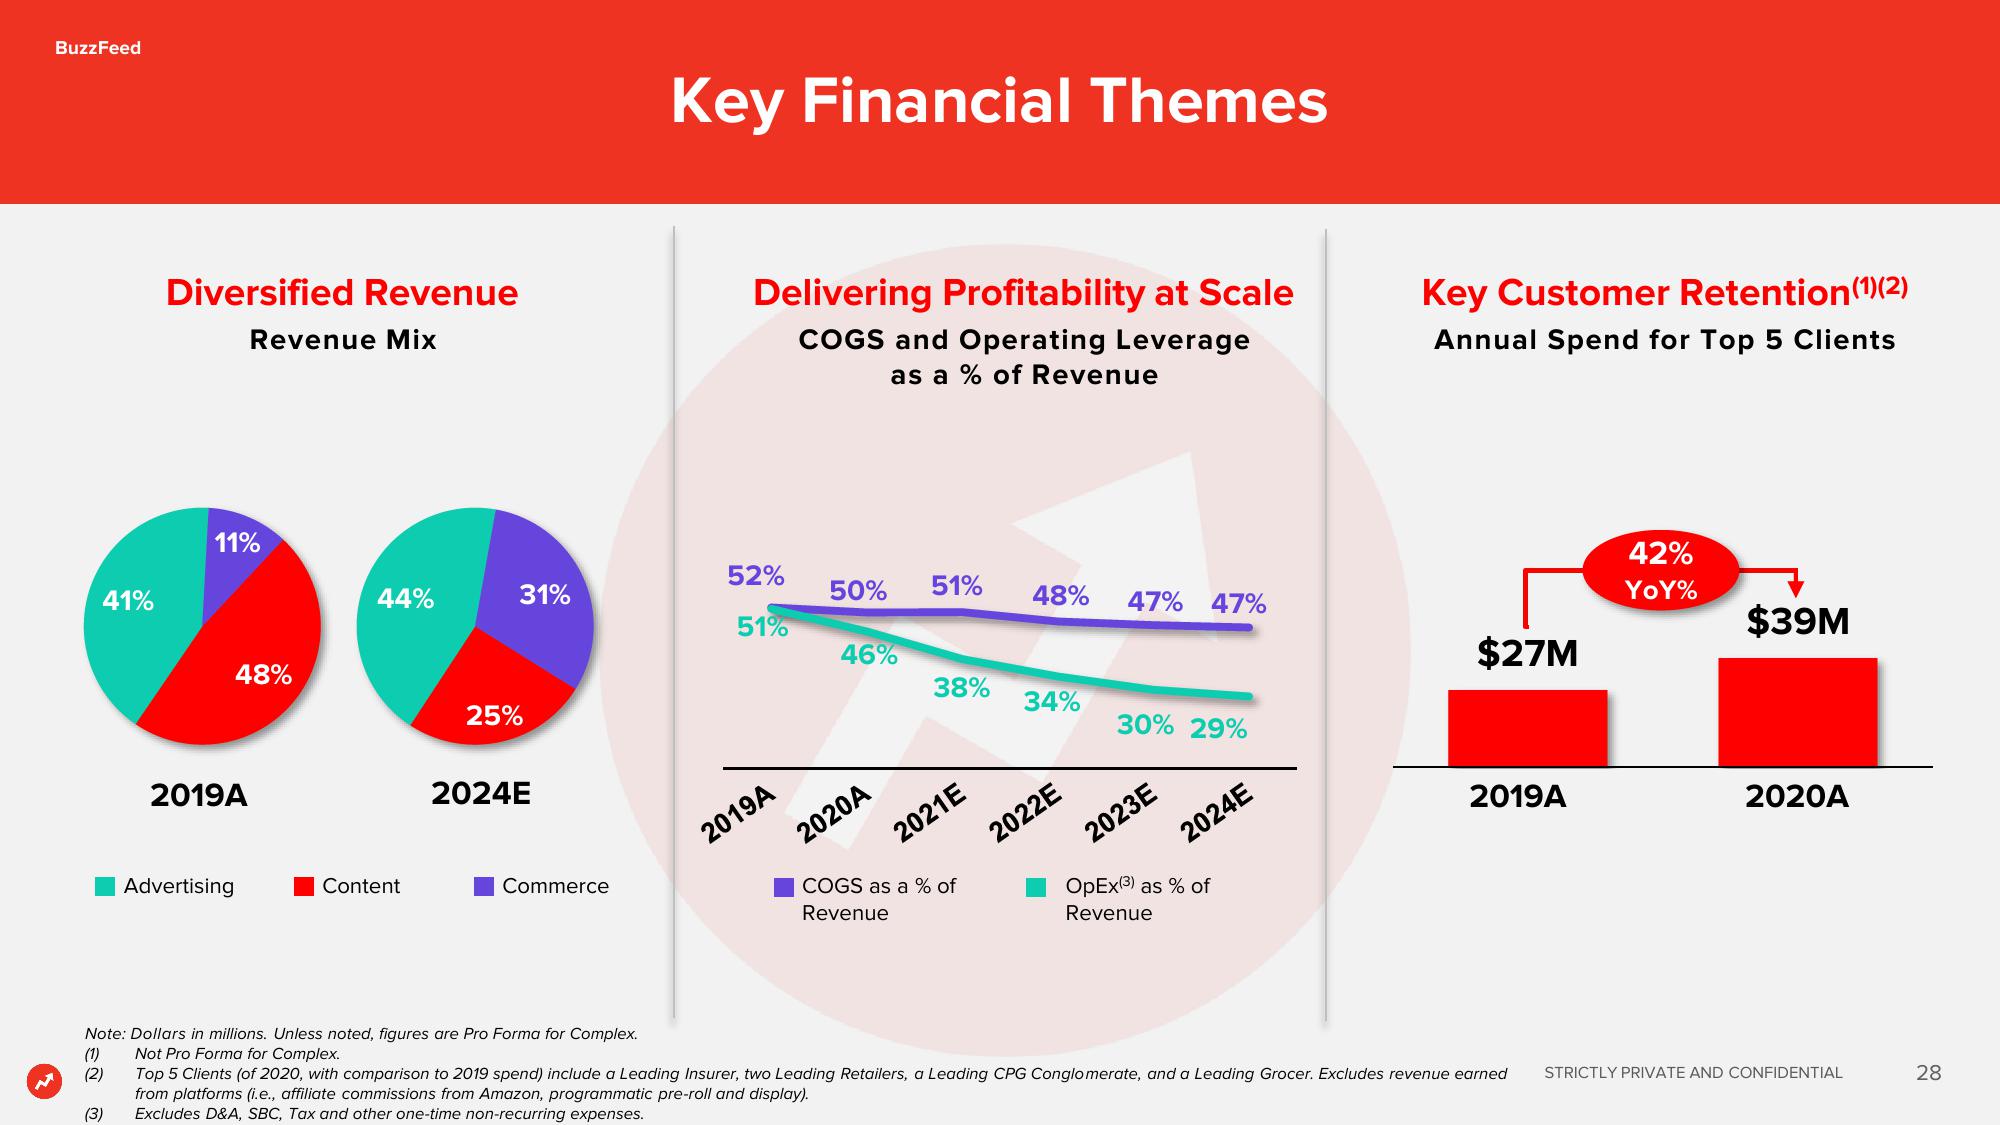
Diversified Revenue
Revenue Mix
(3)
11%
48%
2019A
Advertising
44%
Content
31%
25%
2024E
Commerce
Key Financial Themes
Delivering Profitability at Scale
COGS and Operating Leverage
as a % of Revenue
52%
51%
2019A
50%
46%
2020A
51%
38%
2021E
COGS as a % of
Revenue
48%
34%
2022E
47% 47%
30% 29%
2023E
2024E
OpEx(³) as % of
Revenue
Key Customer Retention (1)(2)
Annual Spend for Top 5 Clients
$27M
2019A
42%
YOY%
$39M
Note: Dollars in millions. Unless noted, figures are Pro Forma for Complex.
Not Pro Forma for Complex.
Top 5 Clients (of 2020, with comparison to 2019 spend) include a Leading Insurer, two Leading Retailers, a Leading CPG Conglomerate, and a Leading Grocer. Excludes revenue earned STRICTLY PRIVATE AND CONFIDENTIAL
from platforms (i.e., affiliate commissions from Amazon, programmatic pre-roll and display).
Excludes D&A, SBC, Tax and other one-time non-recurring expenses.
2020A
28View entire presentation