Telia Company Results Presentation Deck
OPEX delivering to plan
Key drivers
Analogue customer interaction
Many products and legacy
Manual work
Complex IT, technical debt
Non-data driven approach
Fragmented supplier base
Mass communication
Expanding over head
Biggest impact so far from;
Digital omnichannel journeys
Few but common Products
Digitized automated Processes
Scalable standard Platforms
Data empowered People
Few but strategic Partners
Targeted communication
Reduced over head
Platform and Partner consolidation
Fewer attended and more digital customer
interactions
Overhead reduction
Going forward more impact from Common Products and
Platforms and Process efficiency/automation
30
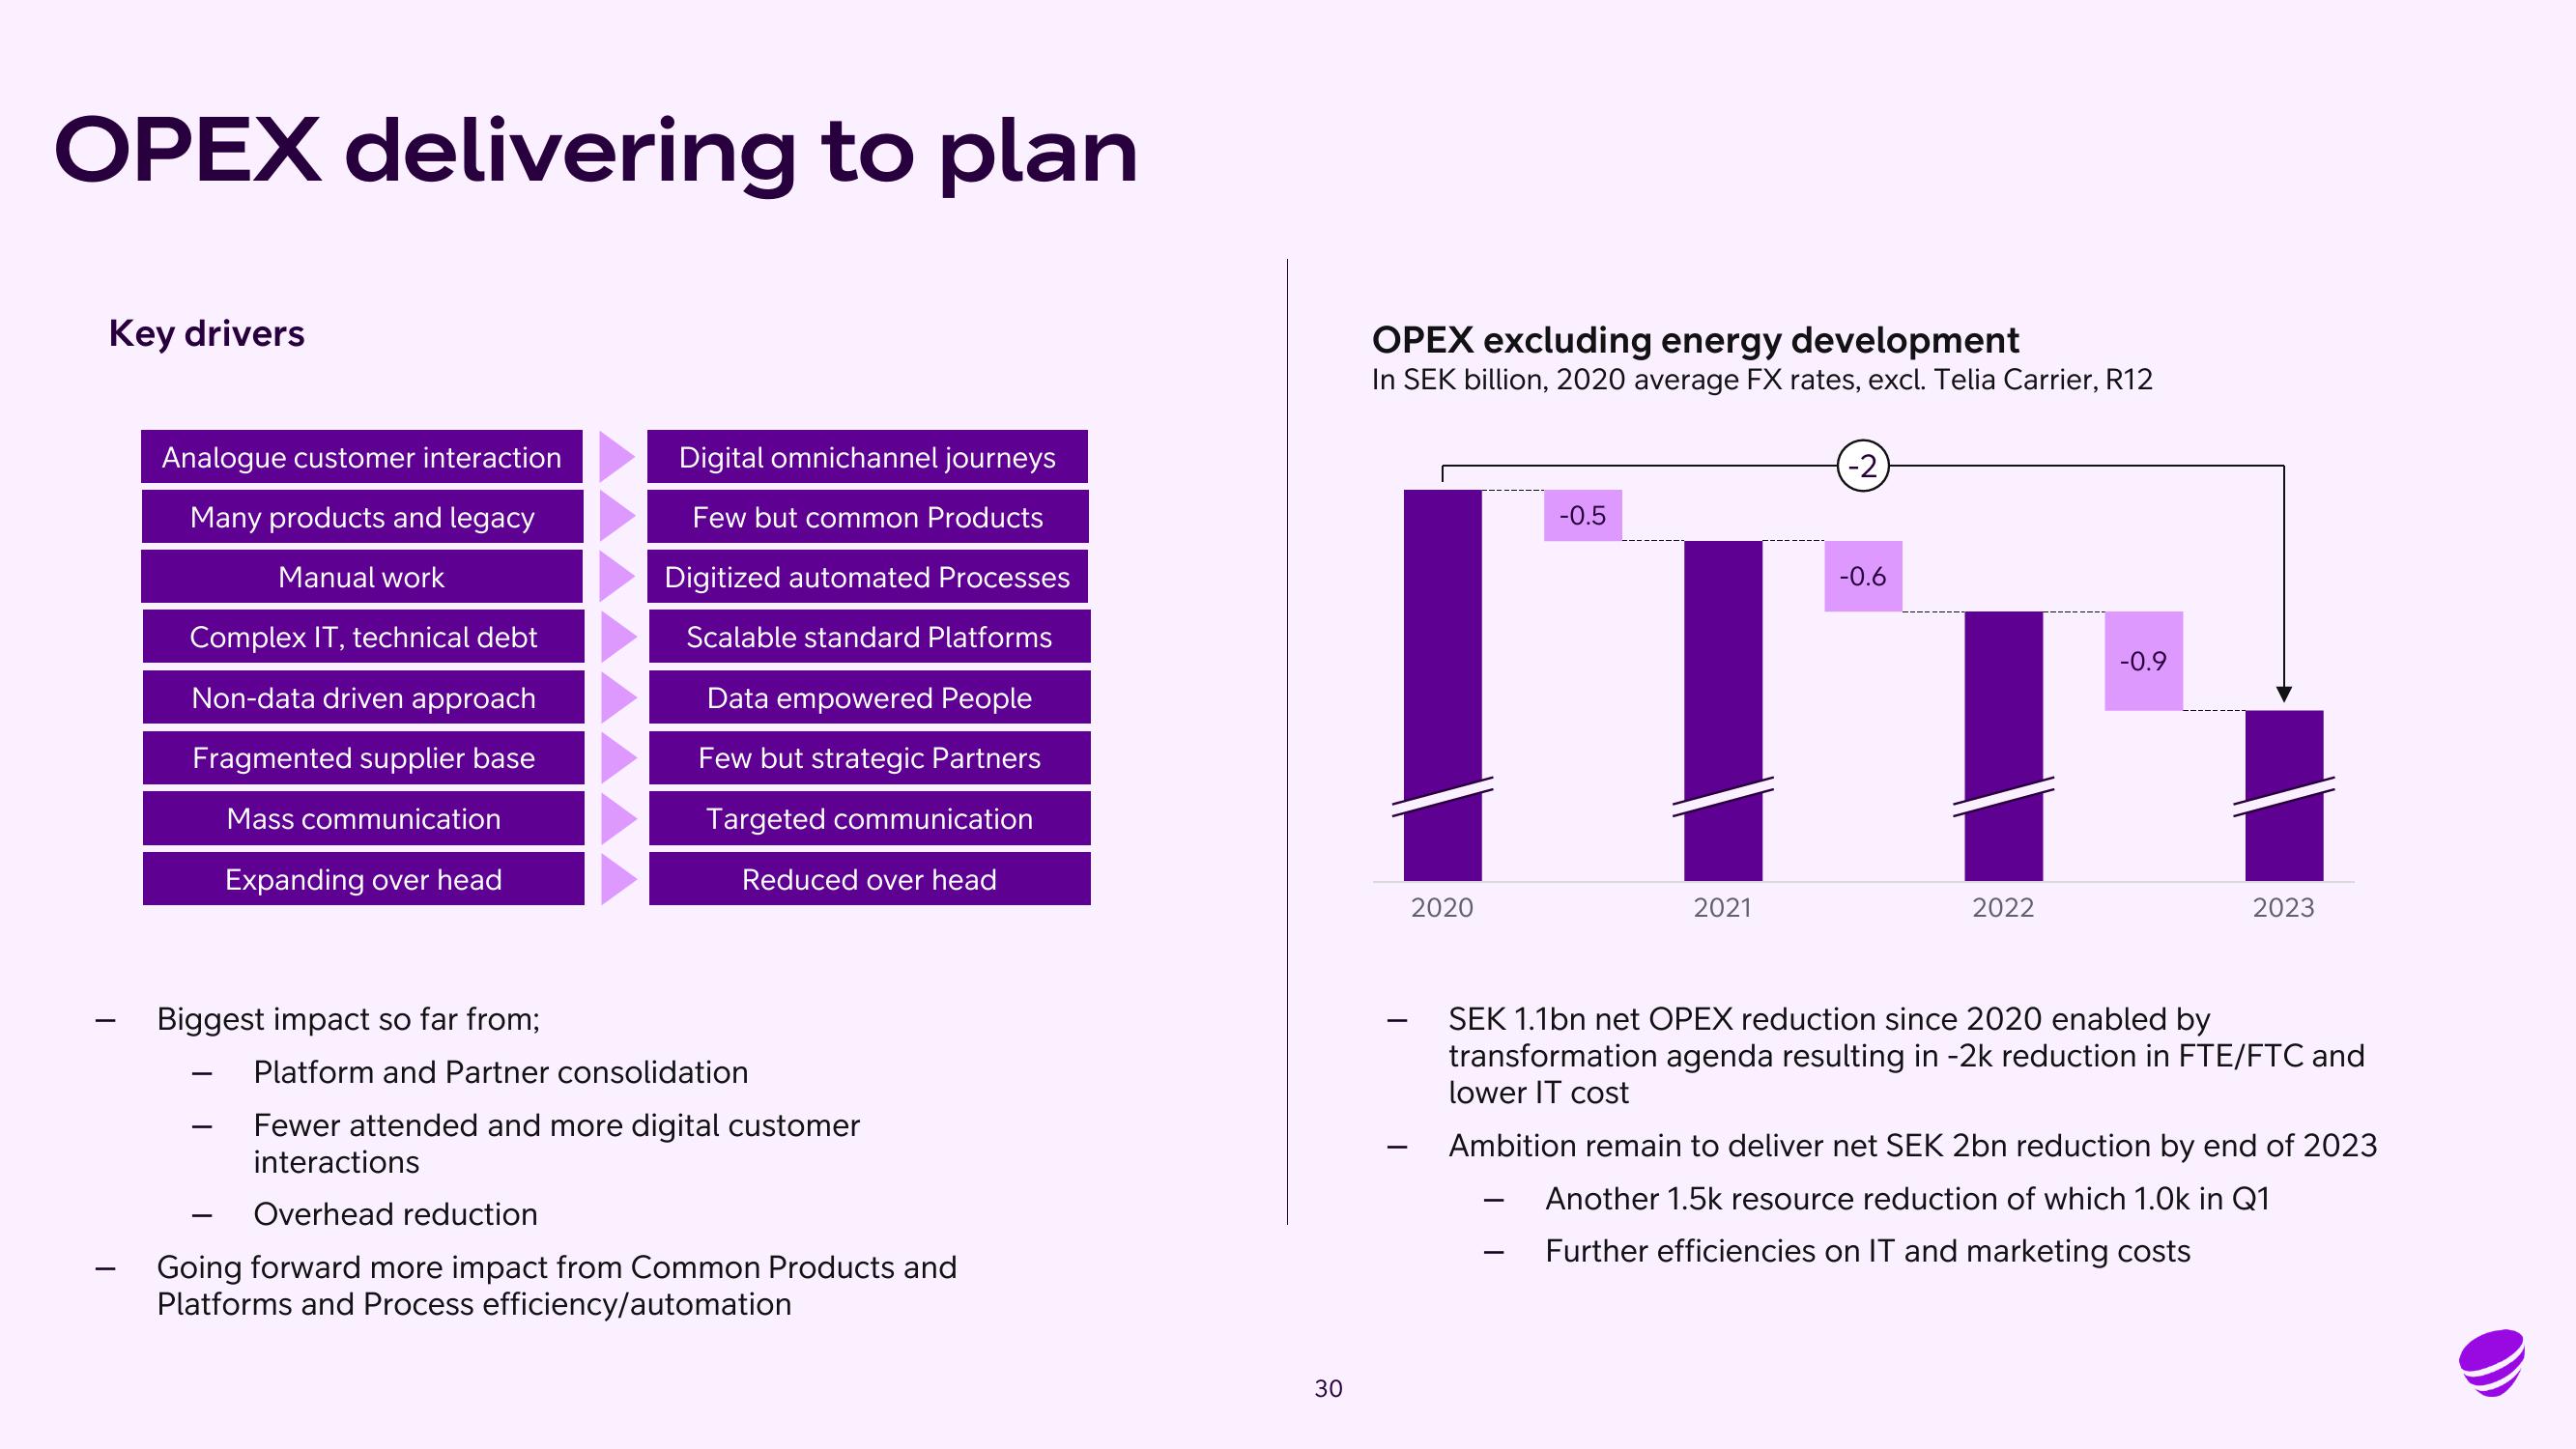
OPEX excluding energy development
In SEK billion, 2020 average FX rates, excl. Telia Carrier, R12
2020
-0.5
-
2021
-
-2
-0.6
2022
-0.9
SEK 1.1bn net OPEX reduction since 2020 enabled by
transformation agenda resulting in -2k reduction in FTE/FTC and
lower IT cost
2023
Ambition remain to deliver net SEK 2bn reduction by end of 2023
Another 1.5k resource reduction of which 1.0k in Q1
Further efficiencies on IT and marketing costsView entire presentation