Roblox Results Presentation Deck
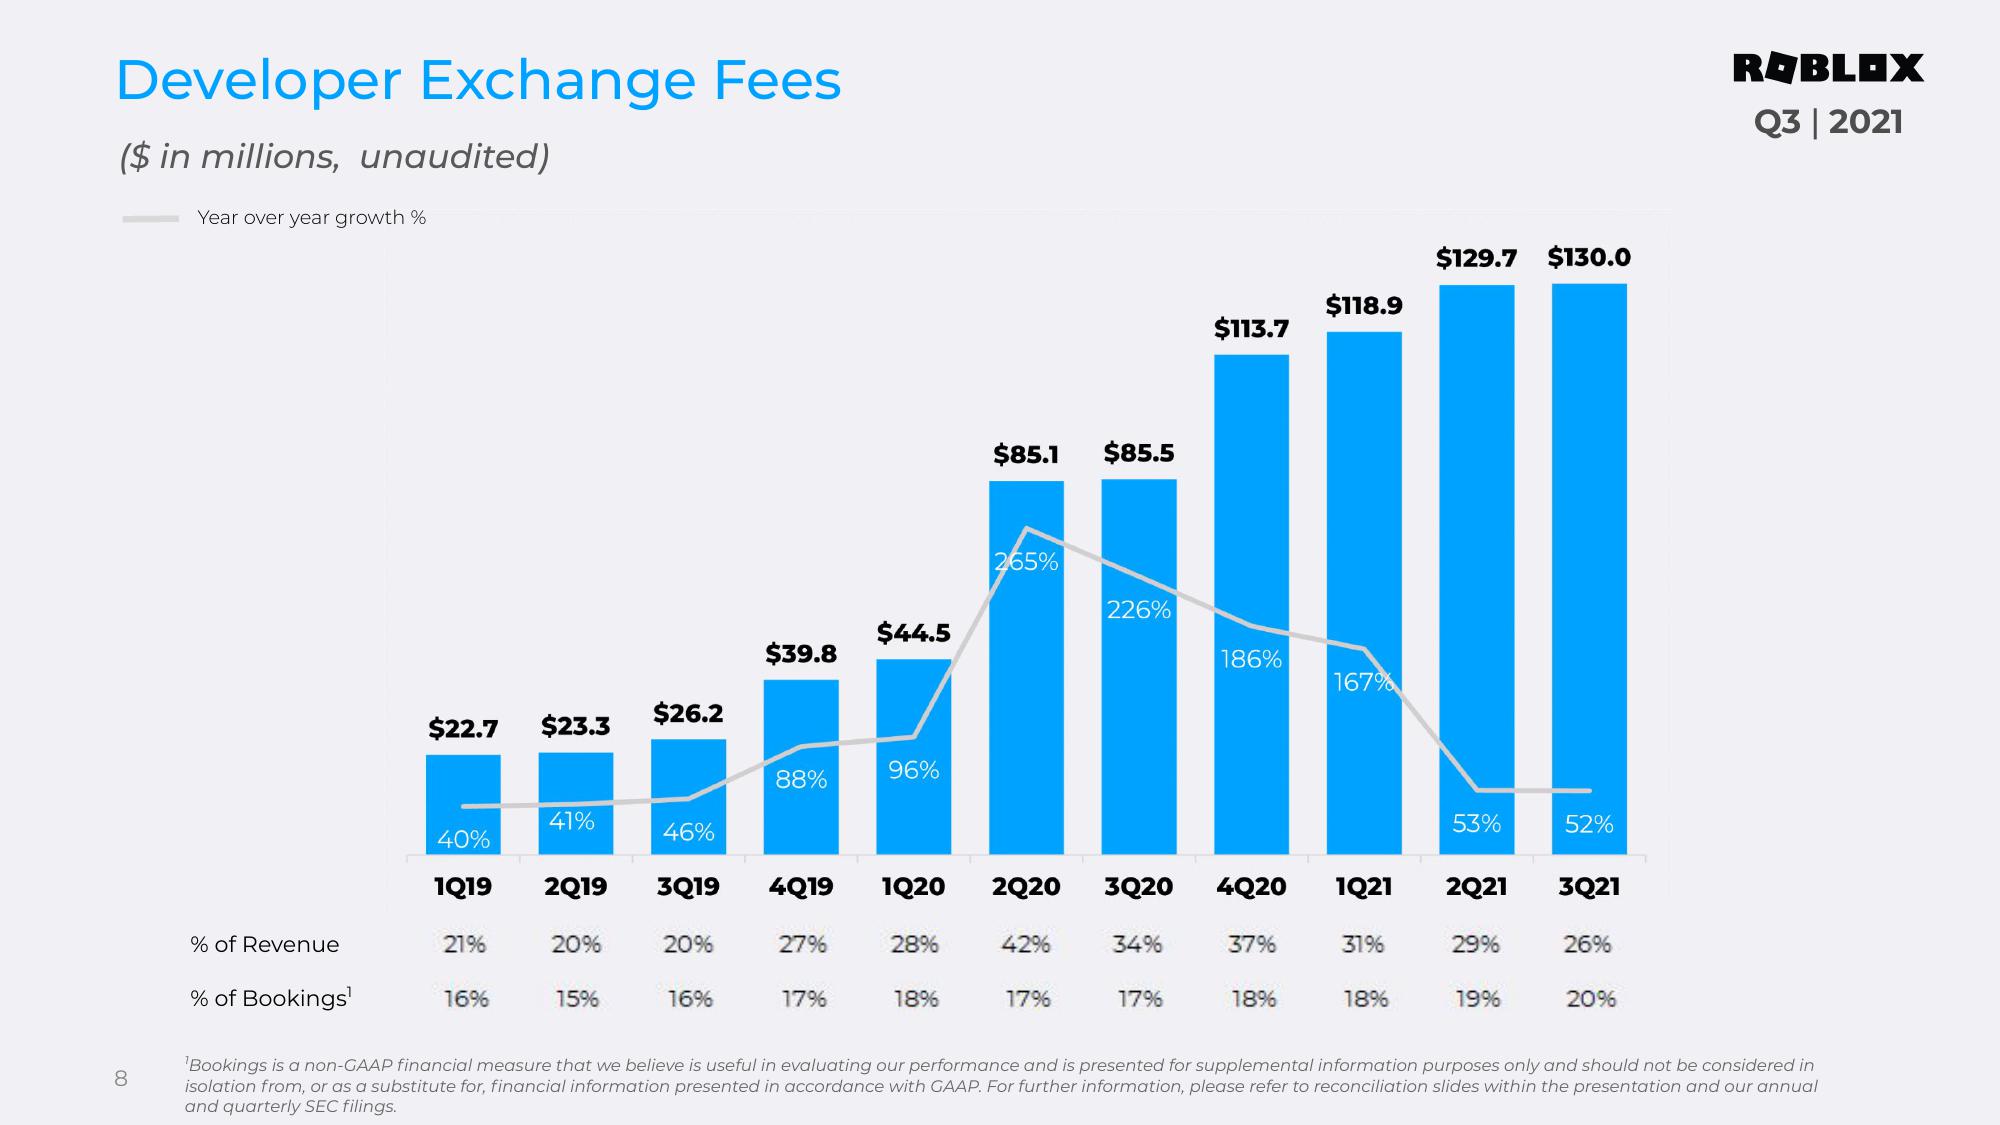
Developer Exchange Fees
($ in millions, unaudited)
Year over year growth %
8
% of Revenue
% of Bookings¹
$22.7 $23.3
40%
1Q19
21%
16%
41%
20%
$26.2
2Q19 3Q19
15%
46%
20%
16%
$39.8
88%
4Q19
27%
17%
$44.5
96%
1Q20
28%
18%
$85.1 $85.5
265%
42%
226%
17%
2Q20 3Q20 4Q20
34%
$113.7
17%
186%
37%
18%
$118.9
167%
1Q21
31%
18%
$129.7
53%
2Q21
29%
19%
$130.0
52%
3Q21
26%
20%
ROBLOX
Q3 | 2021
'Bookings is a non-GAAP financial measure that we believe is useful in evaluating our performance and is presented for supplemental information purposes only and should not be considered in
isolation from, or as a substitute for, financial information presented in accordance with GAAP. For further information, please refer to reconciliation slides within the presentation and our annual
and quarterly SEC filings.View entire presentation