Grindr Investor Presentation Deck
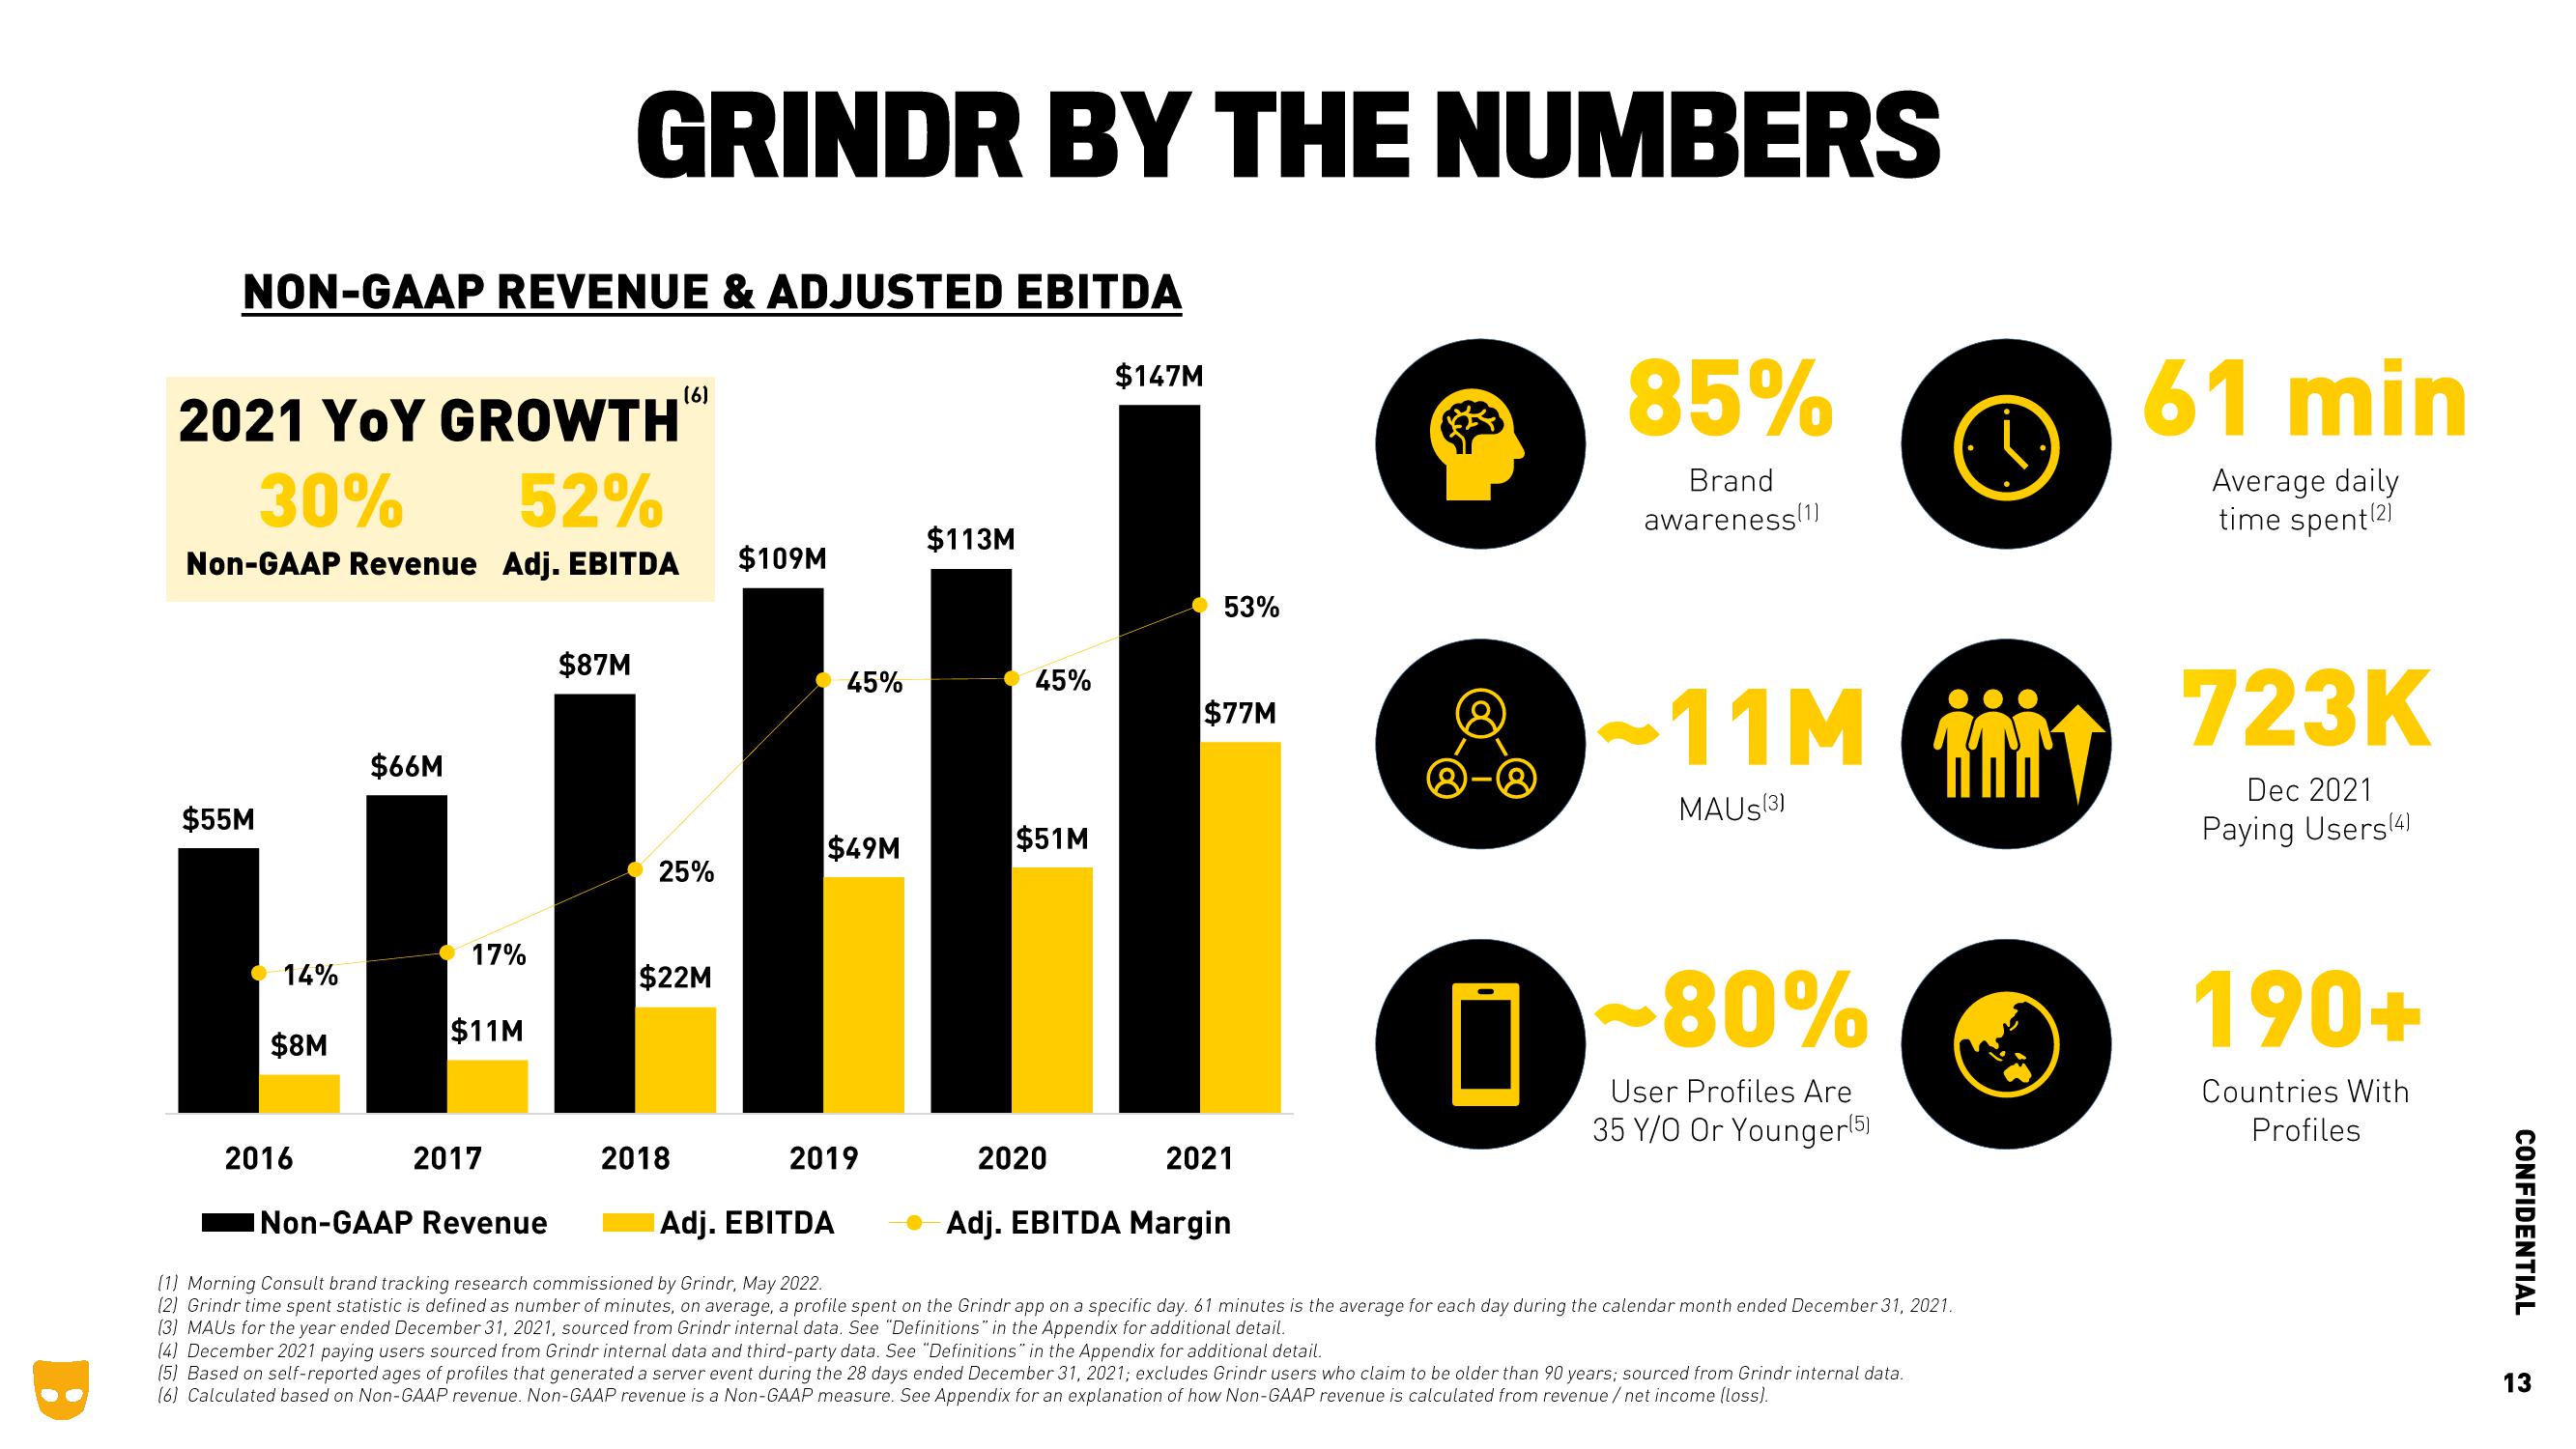
NON-GAAP REVENUE & ADJUSTED EBITDA
$55M
2021 YOY GROWTH
30%
52%
Non-GAAP Revenue Adj. EBITDA $109M
14%
$8M
2016
$66M
17%
$11M
2017
GRINDR BY THE NUMBERS
Non-GAAP Revenue
$87M
(6)
25%
$22M
2018
45%
$49M
2019
Adj. EBITDA
$113M
45%
$51M
2020
$147M
53%
$77M
2021
Adj. EBITDA Margin
85%
Brand
awareness(1)
11M 723K
MAUS (3)
Dec 2021
Paying Users(4)
~80%
User Profiles Are
35 Y/O Or Younger (5)
(1) Morning Consult brand tracking research commissioned by Grindr, May 2022.
(2) Grindr time spent statistic is defined as number of minutes, on average, a profile spent on the Grindr app on a specific day. 61 minutes is the average for each day during the calendar month ended December 31, 2021.
(3) MAUS for the year ended December 31, 2021, sourced from Grindr internal data. See "Definitions" in the Appendix for additional detail.
61 min
Average daily
time spent(2)
(4) December 2021 paying users sourced from Grindr internal data and third-party data. See "Definitions" in the Appendix for additional detail.
(5) Based on self-reported ages of profiles that generated a server event during the 28 days ended December 31, 2021; excludes Grindr users who claim to be older than 90 years; sourced from Grindr internal data.
(6) Calculated based on Non-GAAP revenue. Non-GAAP revenue is a Non-GAAP measure. See Appendix for an explanation of how Non-GAAP revenue is calculated from revenue / net income (loss).
190+
Countries With
Profiles
CONFIDENTIAL
13View entire presentation