WeWork Results Presentation Deck
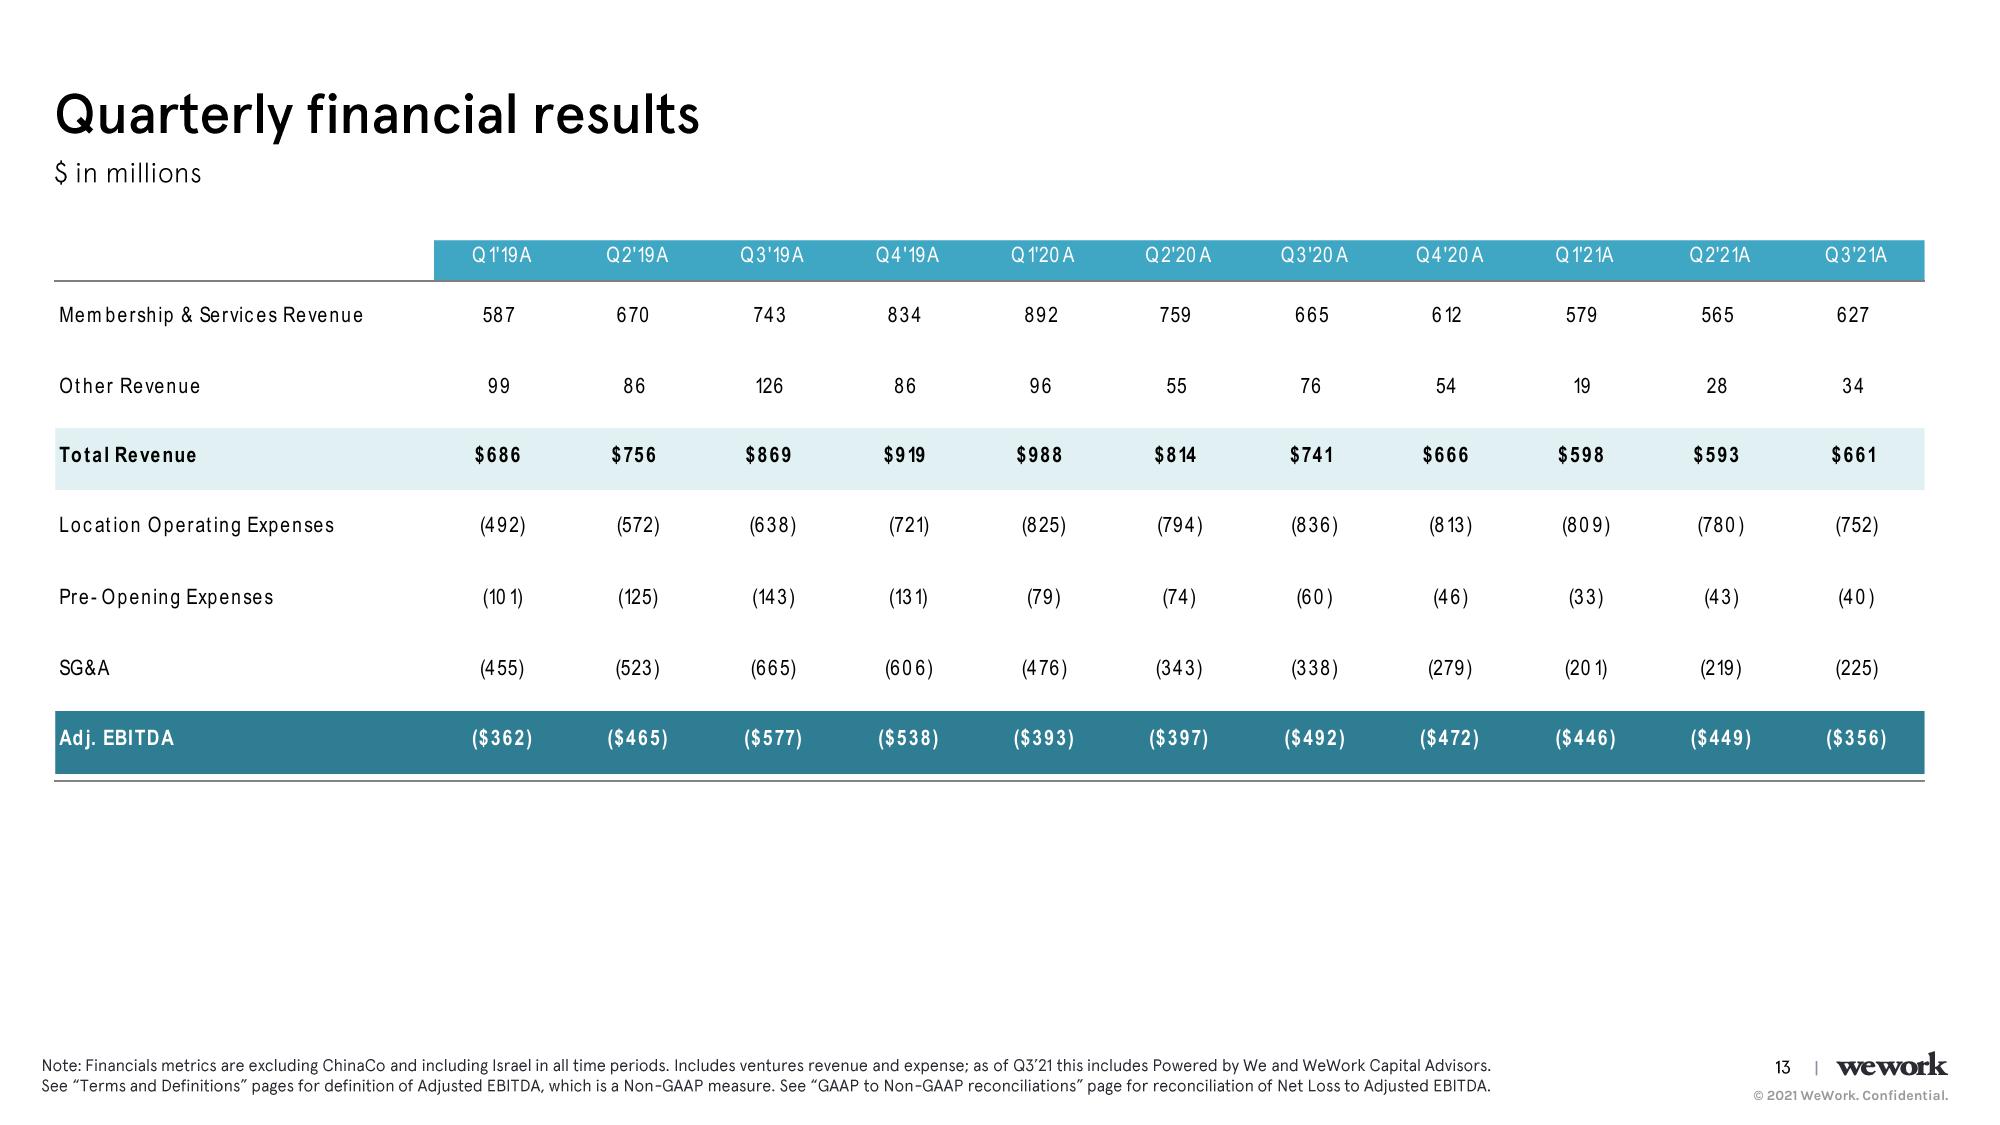
Quarterly financial results
$ in millions
Membership & Services Revenue
Other Revenue
Total Revenue
Location Operating Expenses
Pre-Opening Expenses
SG&A
Adj. EBITDA
Q 1'19 A
587
99
$686
(492)
(101)
(455)
($362)
Q2'19A
670
86
$756
(572)
(125)
(523)
($465)
Q3'19 A
743
126
$869
(638)
(143)
(665)
($577)
Q4'19 A
834
86
$919
(721)
(131)
(606)
($538)
Q 1'20 A
892
96
$988
(825)
(79)
(476)
($393)
Q2'20 A
759
55
$814
(794)
(74)
(343)
($397)
Q3'20 A
665
76
$741
(836)
(60)
(338)
($492)
Q4'20 A
612
54
$666
(813)
(46)
(279)
($472)
Note: Financials metrics are excluding ChinaCo and including Israel in all time periods. Includes ventures revenue and expense; as of Q3'21 this includes Powered by We and WeWork Capital Advisors.
See "Terms and Definitions" pages for definition of Adjusted EBITDA, which is a Non-GAAP measure. See "GAAP to Non-GAAP reconciliations" page for reconciliation of Net Loss to Adjusted EBITDA.
Q1'21A
579
19
$598
(809)
(33)
(201)
($446)
Q2¹21A
565
28
$593
(780)
(43)
(219)
($449)
Q3'21A
627
34
$661
(752)
(40)
(225)
($356)
13 | wework
Ⓒ2021 WeWork. Confidential.View entire presentation