Baird Investment Banking Pitch Book
AR BENCHMARKING
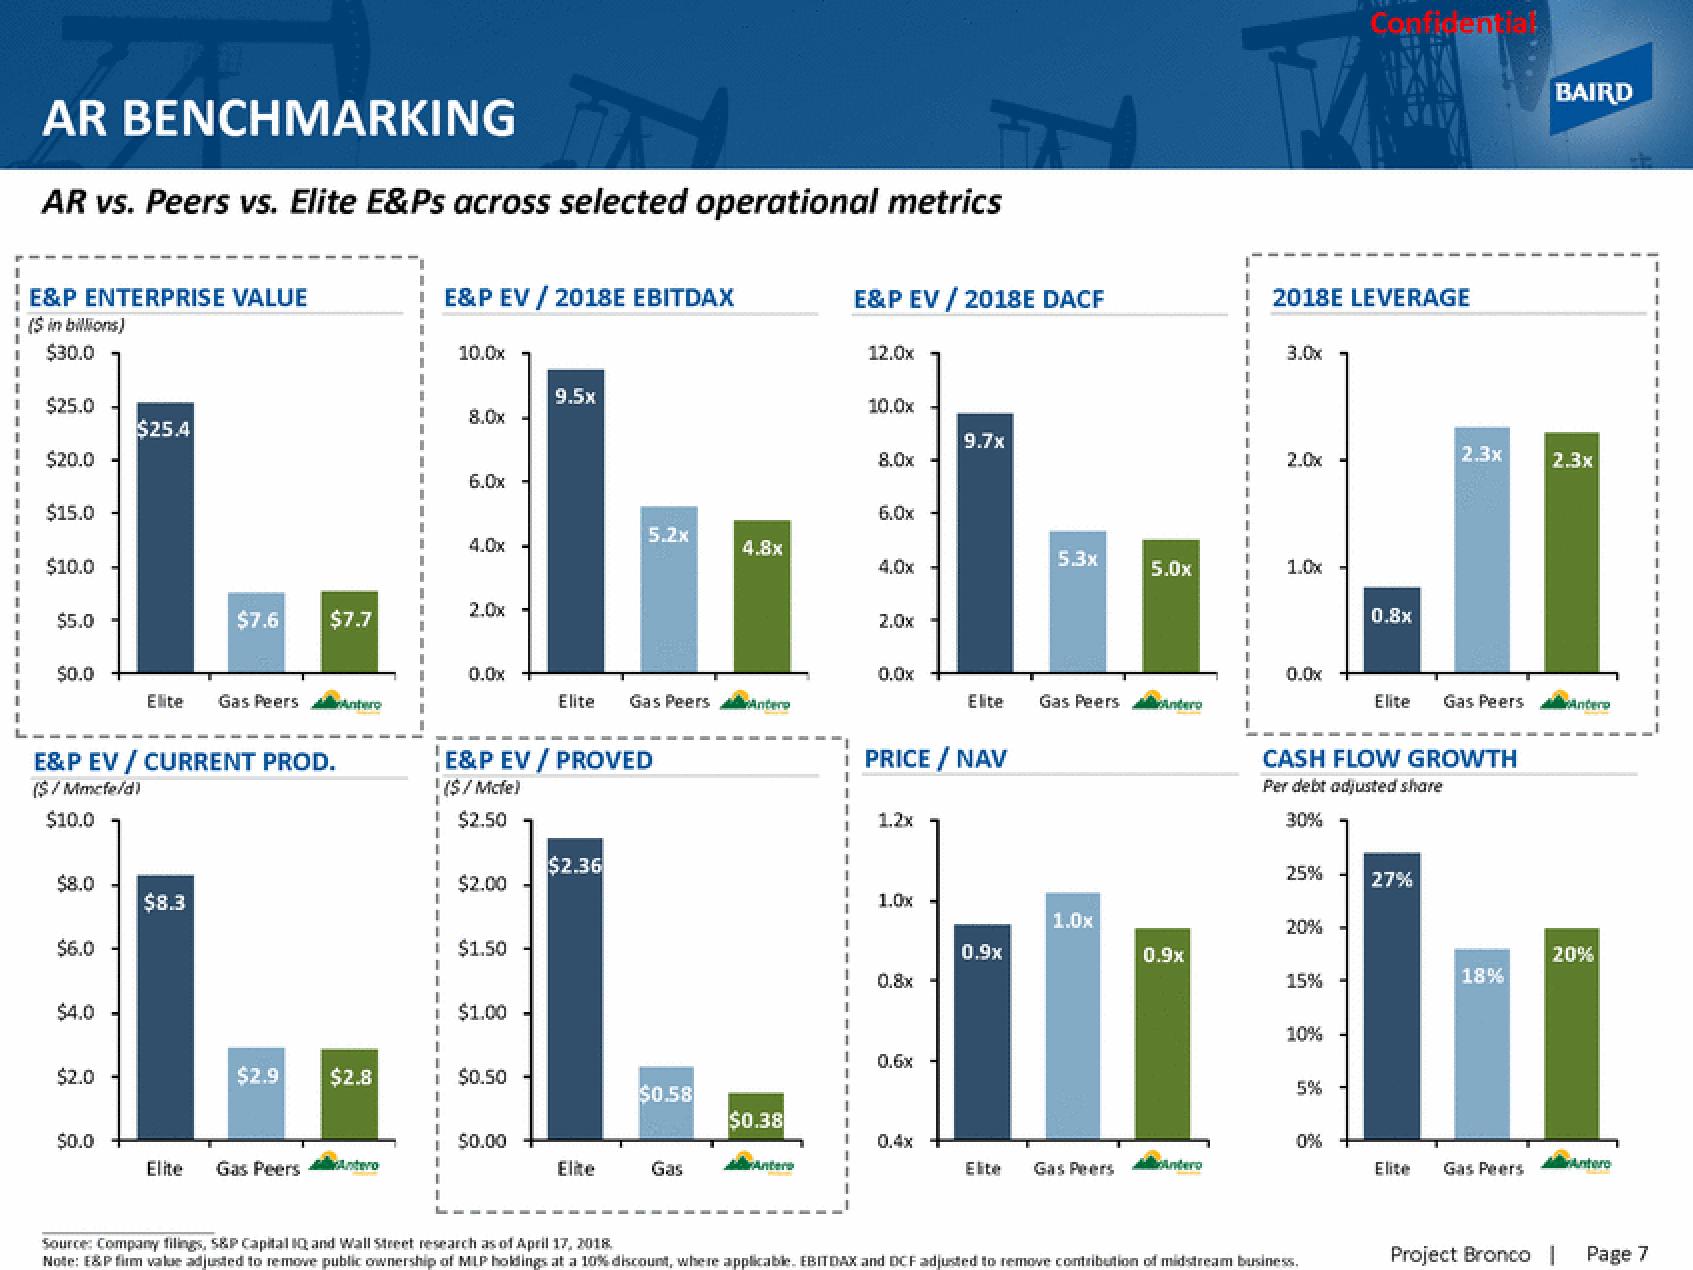
AR vs. Peers vs. Elite E&Ps across selected operational metrics
E&P ENTERPRISE VALUE
($ in billions)
$30.0
$25.0
$20.0
$15.0
$10.0
$5.0
$0.0
$8.0
$6.0
$4.0
E&P EV / CURRENT PROD.
($/Mmcfe/d)
$10.0
$2.0
$25.4
$0.0
Elite Gas Peers
$7.6
$8.3
Elite
$7.7
Gas Peers
Antero
$2.9 $2.8
Antero
E&P EV / 2018E EBITDAX
10.0x
I
8.0x
6.0x
4.0x
2.0x
0.0x
$2.00
E&P EV / PROVED
($/Mcfe)
! $2.50
$1.50
$1.00
i $0.50
9.5x
50.00
5.2x
Elite Gas Peers Avantere
$2.36
Elite
$0.58
4.8x
Gas
$0.38
Antero
E&P EV / 2018E DACF
I
12.0x
10.0x
8.0x
6.0x
4.0x
2.0x
0.0x
i PRICE / NAV
1.2x
1.0x
0.8x
0.6x -
9.7x
0.4x
Elite
0.9x
Elite
5.3x
Gas Peers ondero
1.0x
5.0x
Gas Peers
0.9x
Antero
2018E LEVERAGE
3.0x
2.0x
1.0x
0.0x
25%
20%
15%
10%
CASH FLOW GROWTH
Per debt adjusted share
30%
5%
Confidential
0%
Source: Company filings, S&P Capital IQ and Wall Street research as of April 17, 2018
Note: E&P firm value adjusted to remove public ownership of MLP holdings at a 10% discount, where applicable. EBITDAX and DCF adjusted to remove contribution of midstream business.
0.8x
Elite
27%
2.3x
Elite
Gas Peers
18%
Gas Peers
Project Bronco
BAIRD
2.3x
Spaintera
20%
Antero
Page 7
1
I
1
IView entire presentation