Moelis & Company Investment Banking Pitch Book
(5 in millions, except per share values) 03/31/15A 2020E
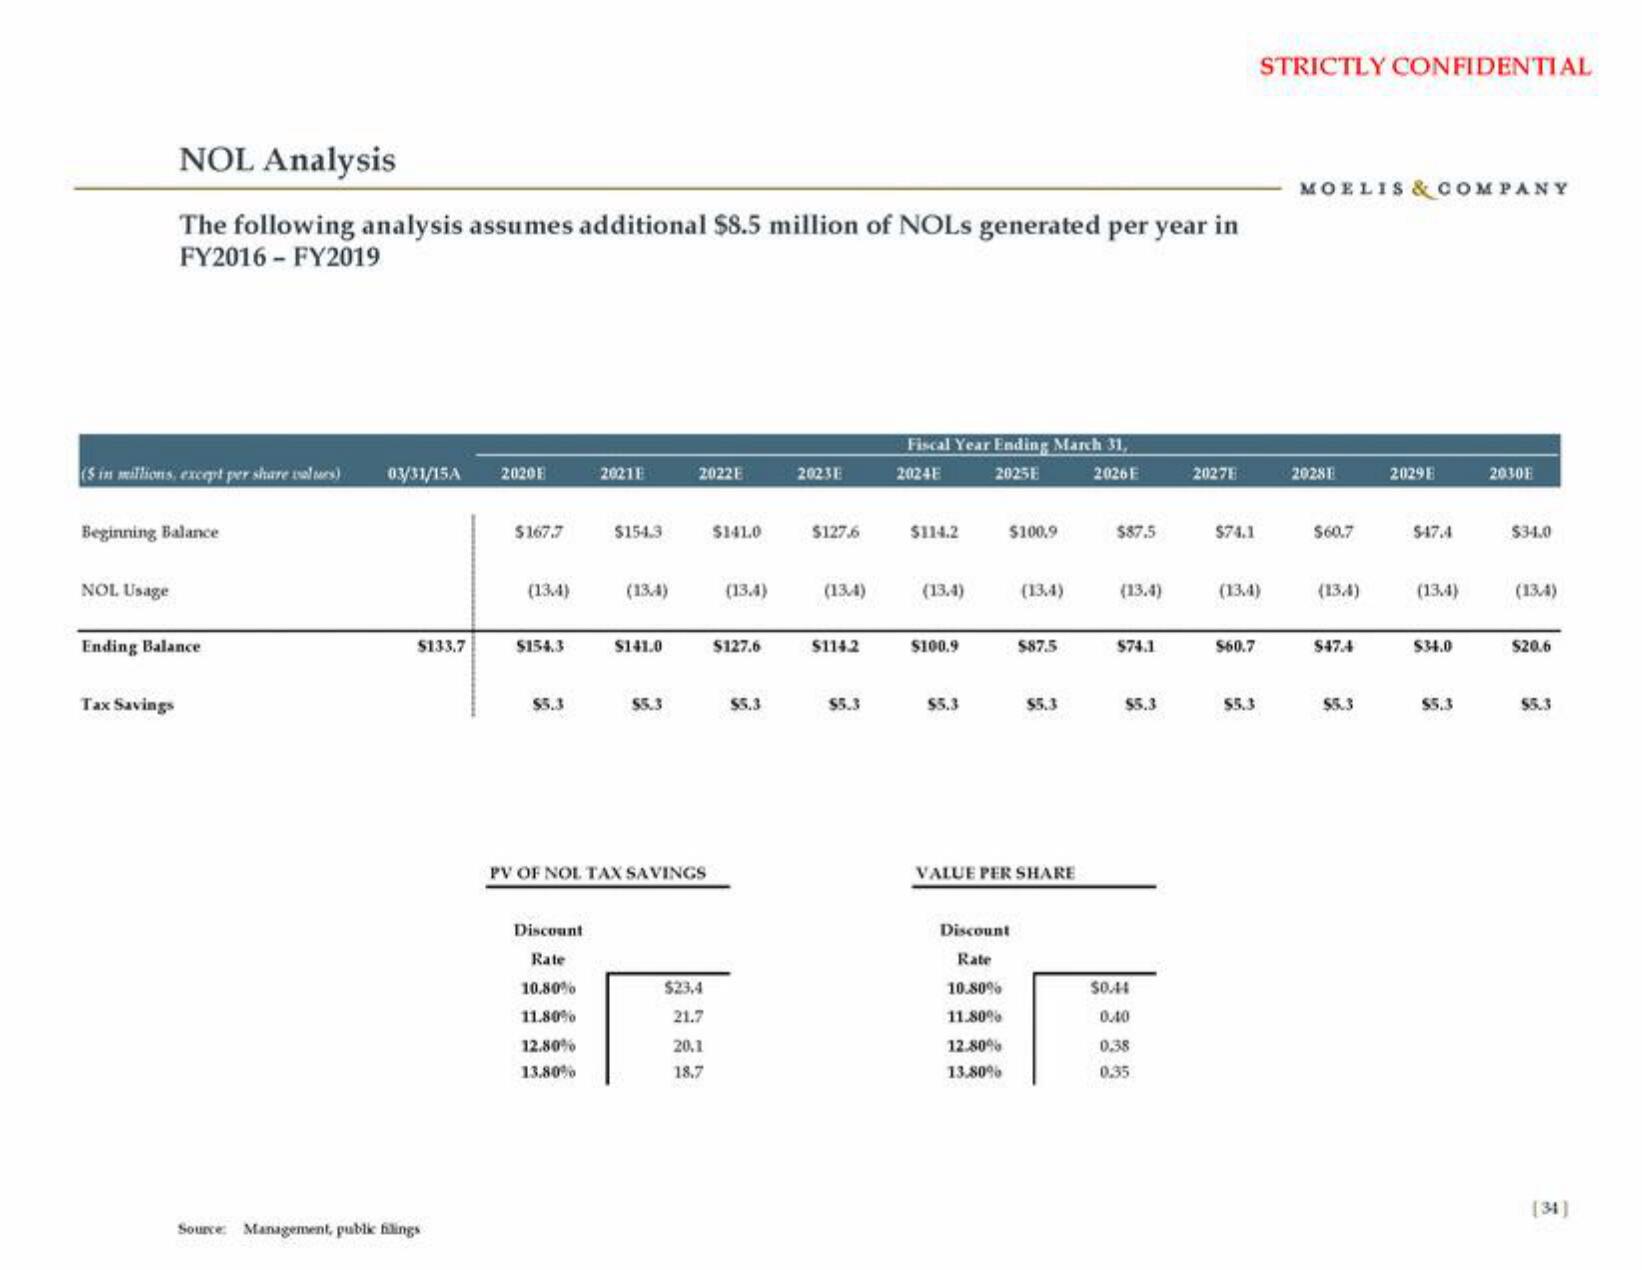
NOL Analysis
The following analysis assumes additional $8.5 million of NOLs generated per year in
FY2016- FY2019
Beginning Balance
NOL Usage
Ending Balance
Tax Savings
$133.7
Source Management, public filings
$167.7
(134)
$154.3
$5.3
2021E
Discount
Rate
10.80%
11.80%
12.80%
13.80%
$154.3
(134)
$141.0
$5.3
2022E
PV OF NOL TAX SAVINGS
$23,4
21.7
20.1
18.7
$141.0
(13.4)
$127.6
$5.3
2023E
$127.6
(134)
$114.2
$5.3
Fiscal Year Ending March 31,
2024E
2025E
2026E
$114.2
(13.4)
$100.9
$5.3
$100,9
(13.4)
Discount
Rate
10.80%
11.80%
12.80%
13.80%
$87.5
$5.3
VALUE PER SHARE
$87.5
(13.4)
$74.1
$5.3
$0.44
0.40
0.38
0.35
20271
$74.1
(13.4)
$60.7
STRICTLY CONFIDENTIAL
$5.3
MOELIS & COMPANY
20281
$60.7
(134)
$47.4
$5.3
2029E
$47.4
(13.4)
$34.0
$5.3
2030E
$34.0
(134)
$20.6
$5.3
[34]View entire presentation