Azek IPO Presentation Deck
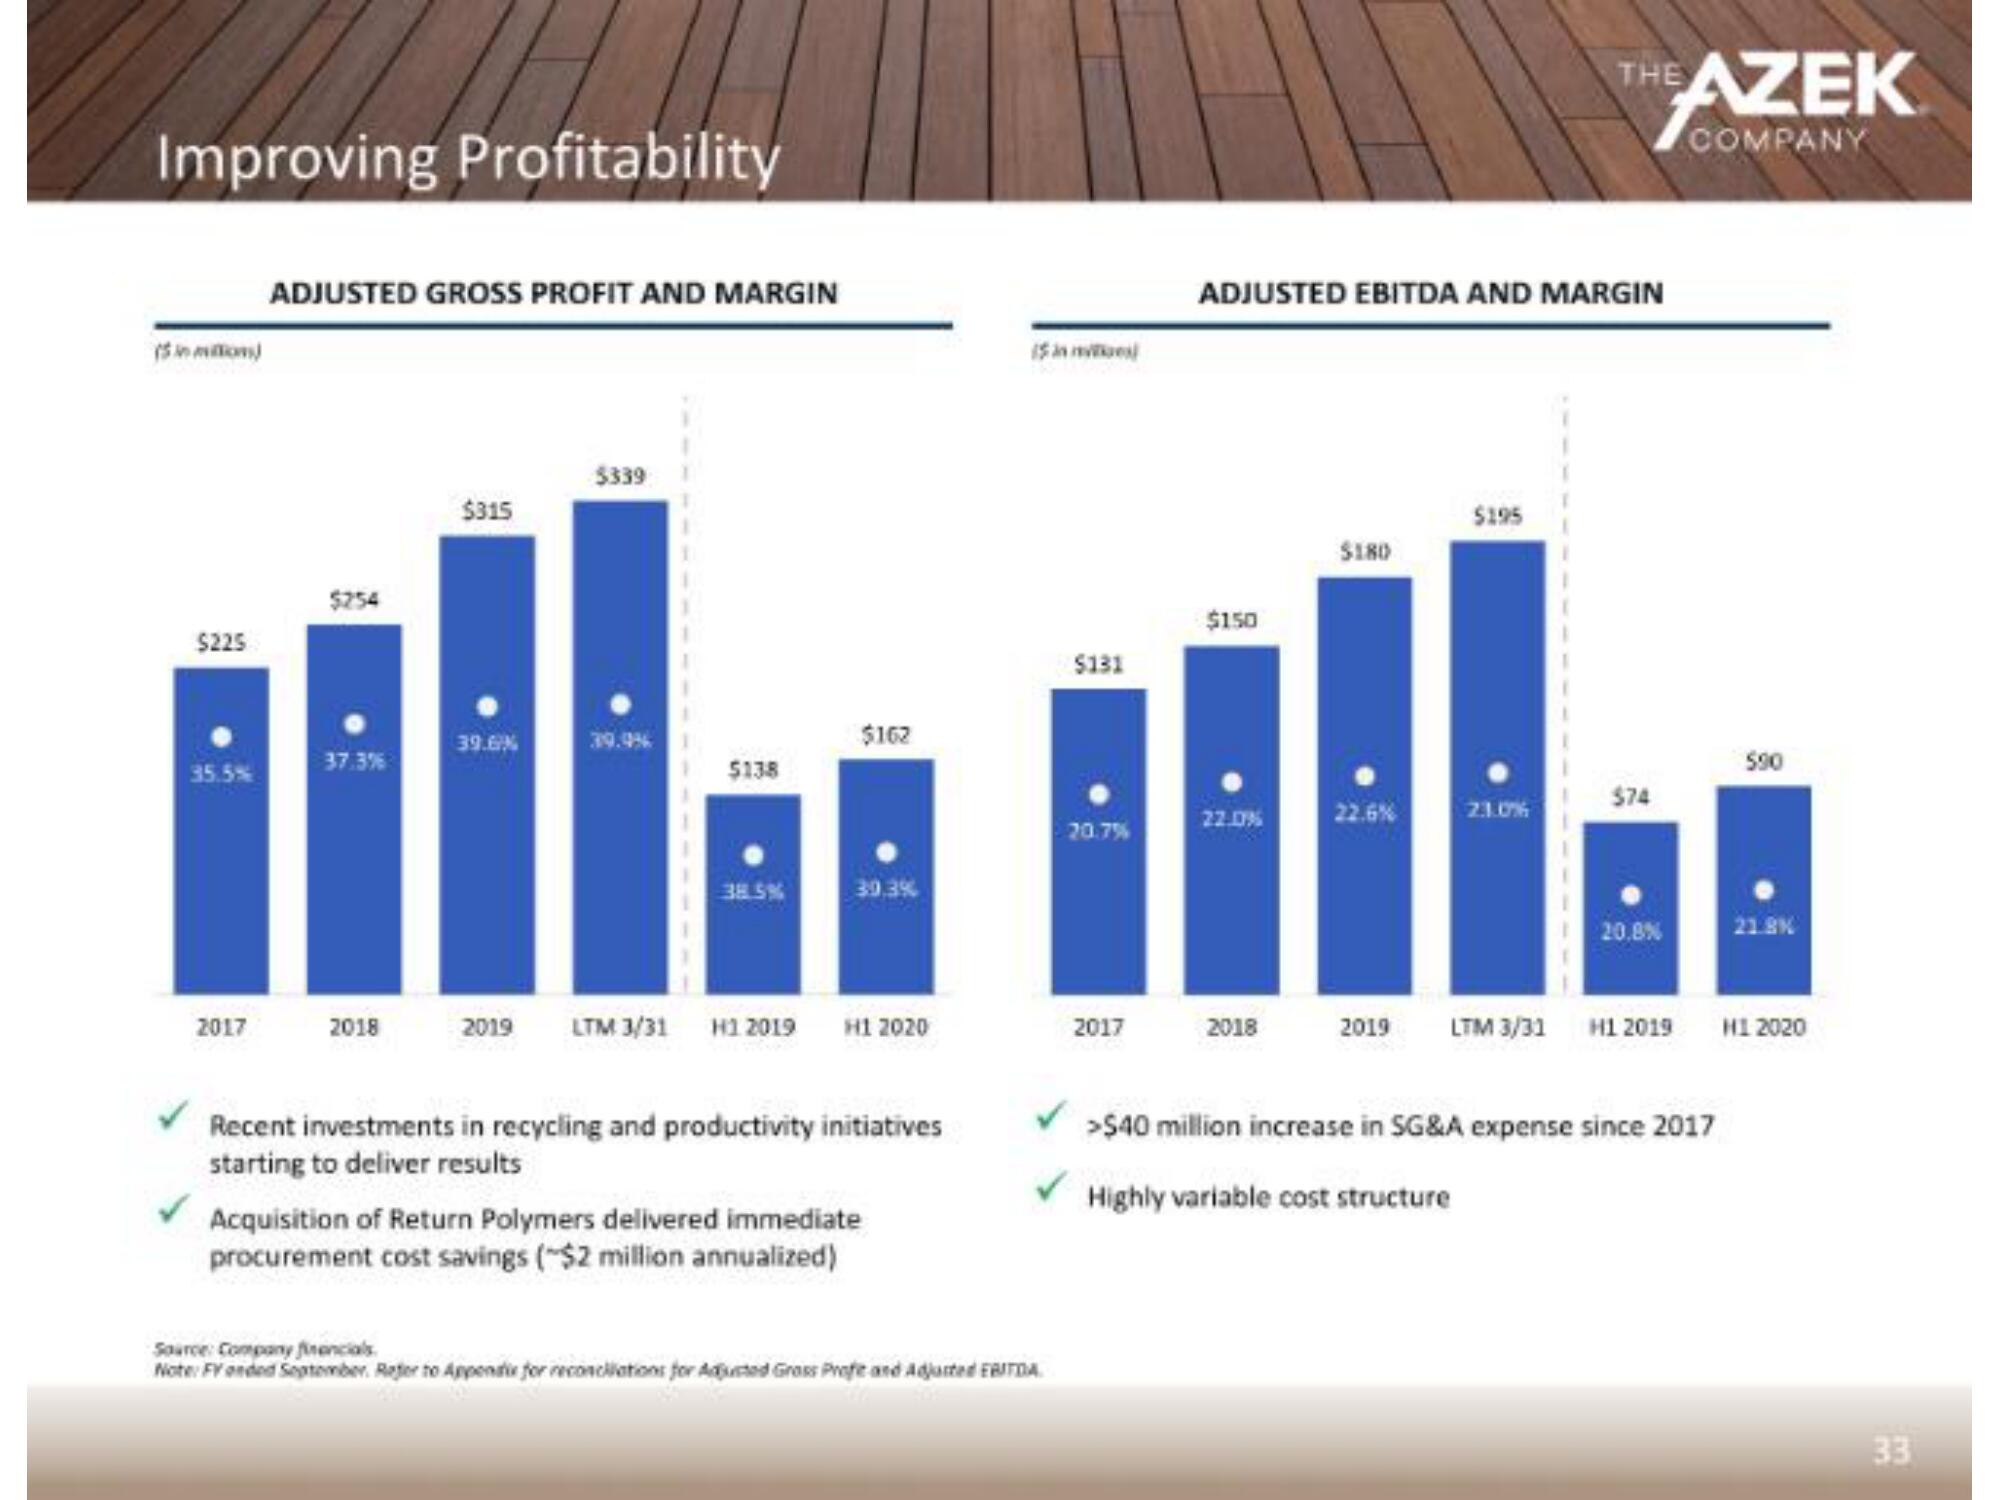
Improving Profitability
($inion)
$225
35.5%
2017
ADJUSTED GROSS PROFIT AND MARGIN
$254
37.3%
2018
$315
39.6%
$339
$138
38.5%
$162
39.3%
2019 LTM 3/31 H1 2019 H1 2020
Recent investments in recycling and productivity initiatives
starting to deliver results
Acquisition of Return Polymers delivered immediate
procurement cost savings (~$2 million annualized)
($n
$131
Source: Company financials
Note: FY onded September. Refer to Appende for reconciliations for Adjusted Gross Profe and Adjusted EBITDA
20.7%
2017
ADJUSTED EBITDA AND MARGIN
$150
27.0%
2018
$180
22.6%
$195
THE AZEK
COMPANY
23.0%
$74
20.8%
✓ >$40 million increase in SG&A expense since 2017
Highly variable cost structure
$90
21.8%
2019 LTM 3/31 H1 2019 H1 2020
33View entire presentation