J.P.Morgan Results Presentation Deck
Consumer & Community Banking ¹
SELECTED INCOME STATEMENT DATA ($MM)
Revenue
Banking & Wealth Management²
Home Lending
Card Services & Auto
Expense²
Credit costs
Net charge-offs (NCOs)
Change in allowance
Net income
Average equity
ROE
Overhead ratio²
Average loans
Average deposits
Active mobile customers (mm)4
Debit & credit card sales volume 5
Reported
$17,233
10,936
1,007
5,290
8,313
1,862
1,251
611
$5,306
1 See note 1 on slide 11
2 See note 3 on slide 12
For additional footnotes see slide 13.
KEY DRIVERS / STATISTICS ($B)³
2Q23
Reported
$54.3
38%
48
$518.3
1,157.3
52.0
$424.0
2Q23
FR impact
$831
596
235
37
408
JPMORGAN CHASE & CO.
-
408
$293
FR impact
$2.3
(2)
$59.9
47.2
n.a.
$0.4
ex. FR
$16,402
10,340
772
5,290
8,276
1,454
1,251
203
$5,013
ex. FR
$52.0
38%
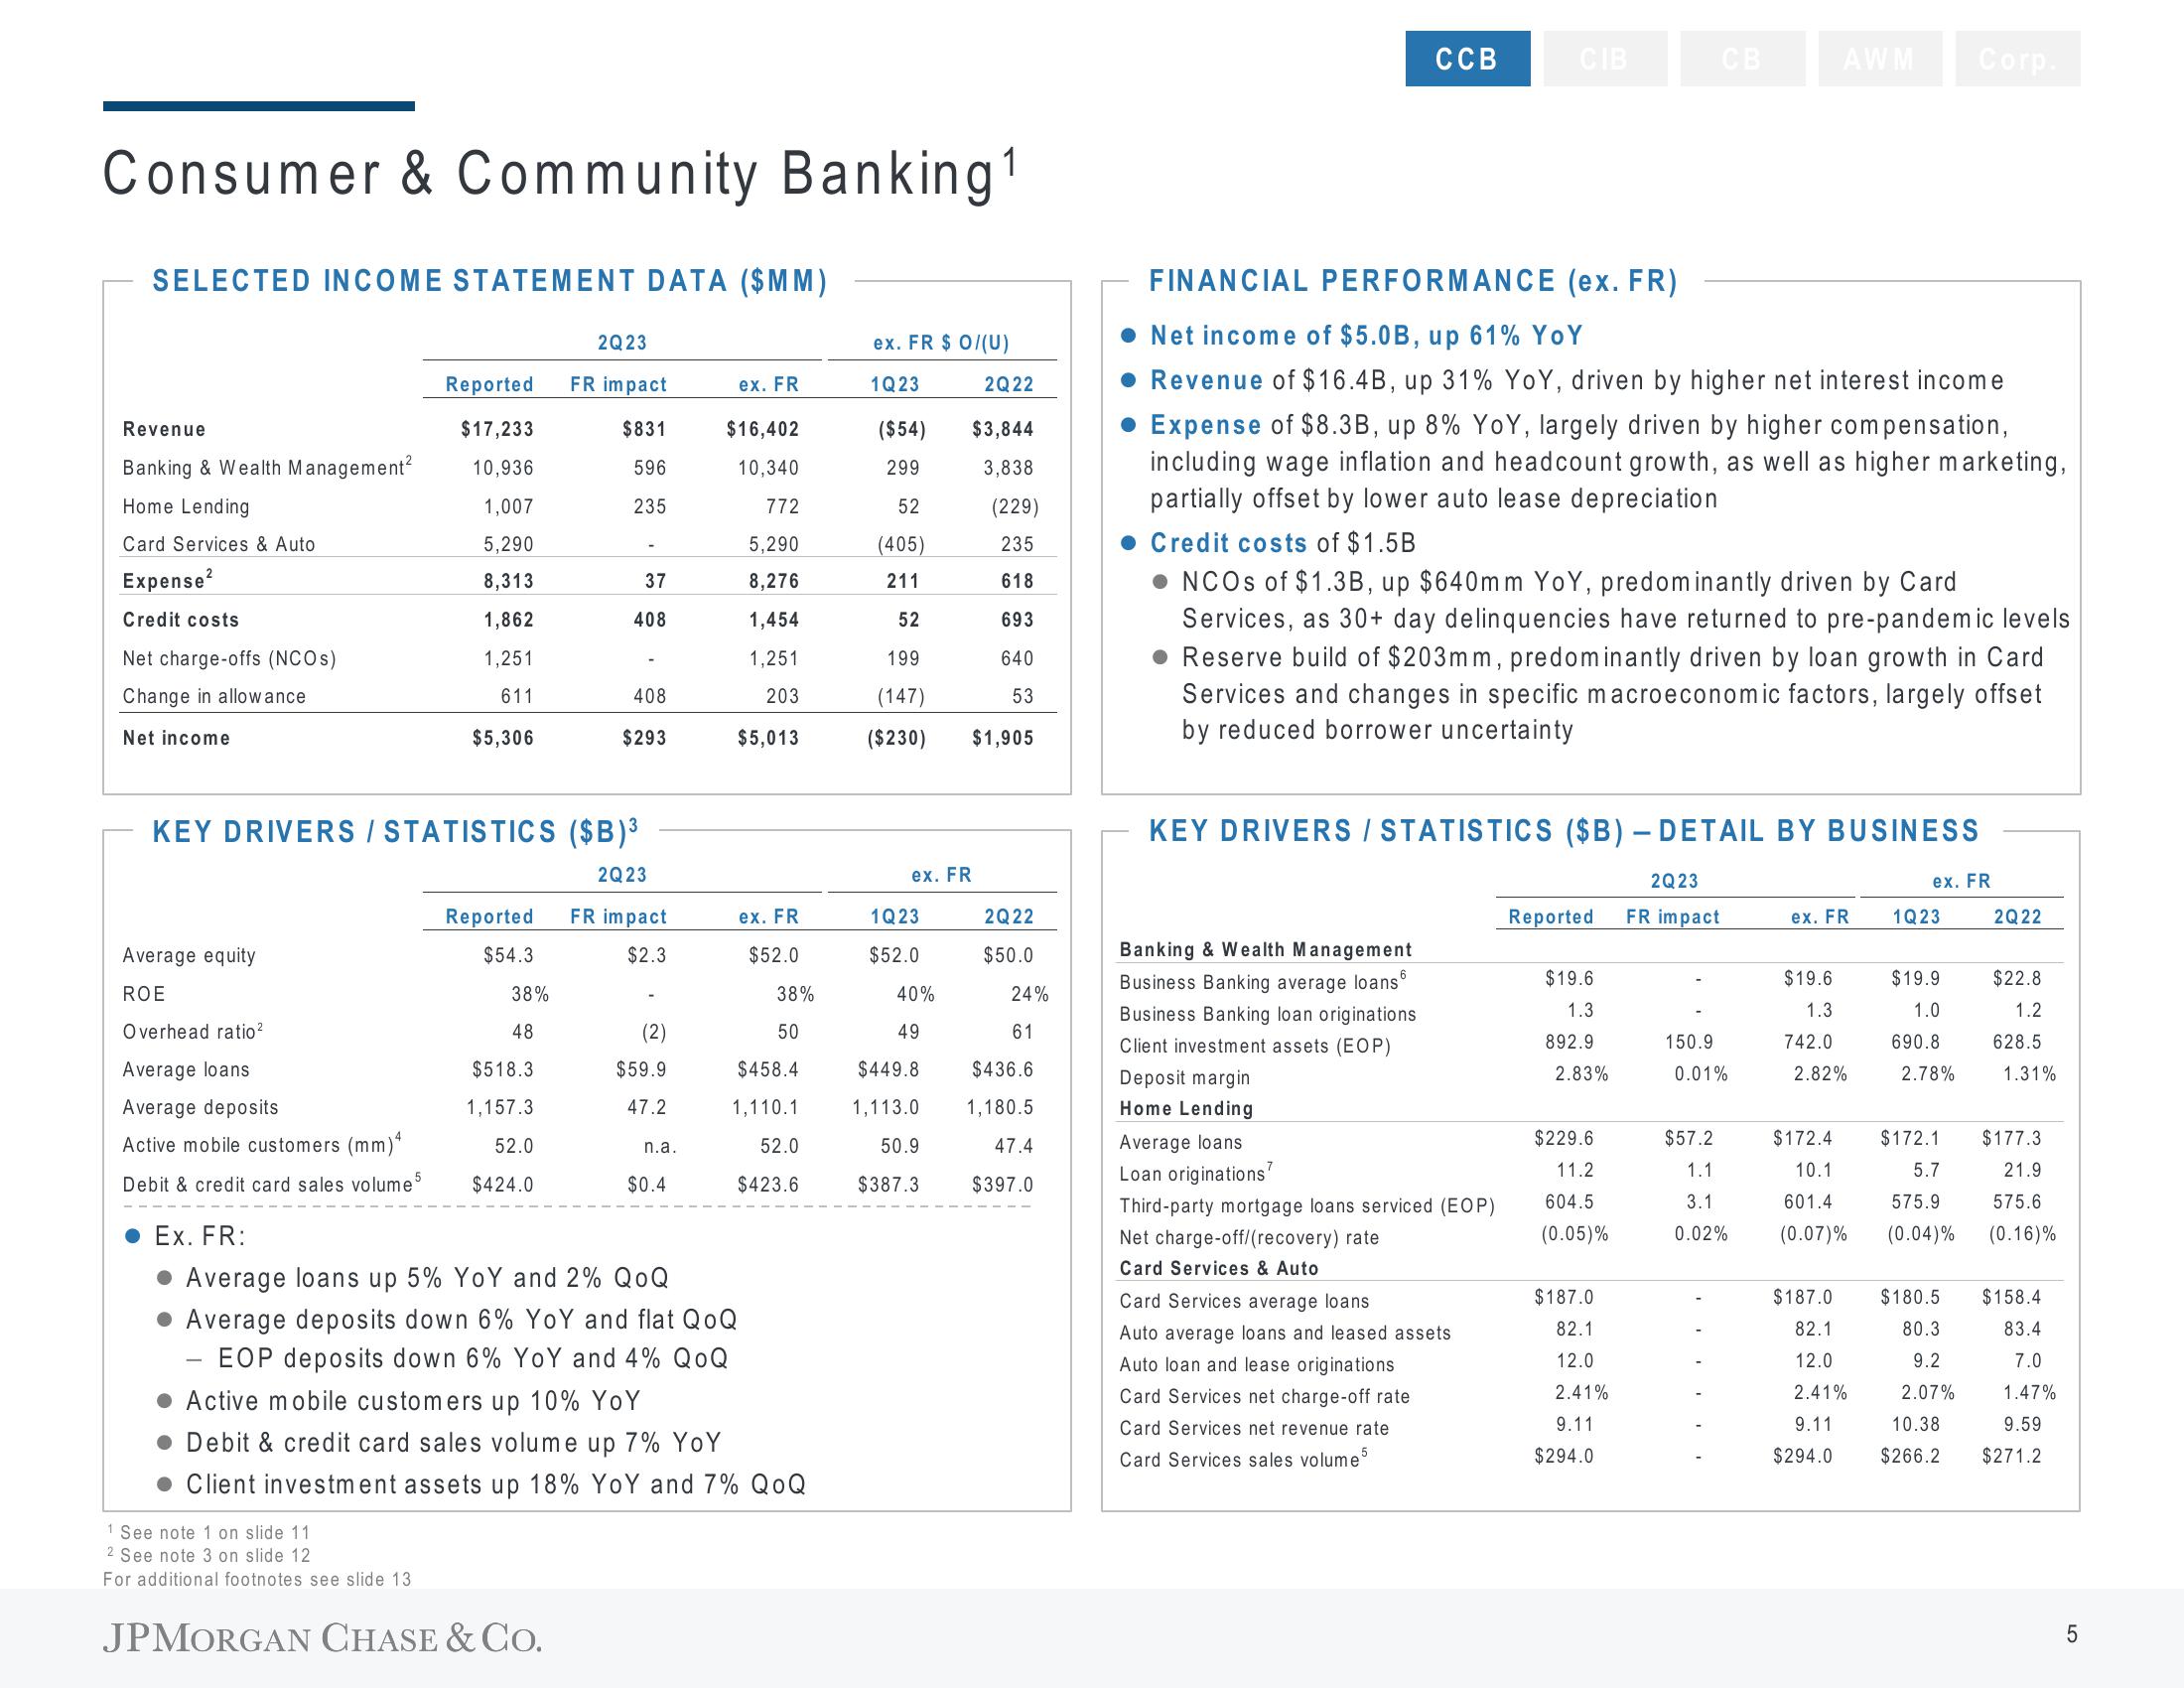
Ex. FR:
Average loans up 5% YoY nd 2% QoQ
Average deposits down 6% YoY and flat QoQ
-EOP deposits down 6% YoY and 4% QOQ
Active mobile customers up 10% YoY
Debit & credit card sales volume up 7% YoY
Client investment assets up 18% YoY and 7% QOQ
50
$458.4
1,110.1
52.0
$423.6
ex. FR $ 0/(U)
2Q22
$3,844
3,838
(229)
235
1Q23
($54)
299
52
(405)
211
52
199
(147)
53
($230) $1,905
618
693
640
ex. FR
1Q23
$52.0
40%
49
$449.8
1,113.0
50.9
$387.3
2Q22
$50.0
24%
61
$436.6
1,180.5
47.4
$397.0
CCB
Banking & Wealth Management
Business Banking average loans
Business Banking loan originations
Client investment assets (EOP)
Deposit margin
Home Lending
Average loans
Loan originations
CIB
FINANCIAL PERFORMANCE (ex. FR)
Net income of $5.0B, up 61% YoY
Revenue of $16.4B, up 31% YoY, driven by higher net interest income
• Expense of $8.3B, up 8% YoY, largely driven by higher compensation,
including wage inflation and headcount growth, as well as higher marketing,
partially offset by lower auto lease depreciation
Credit costs of $1.5B
NCOs of $1.3B, up $640mm YoY, predominantly driven by Card
Services, as 30+ day delinquencies have returned to pre-pandemic levels
Reserve build of $203mm, predominantly driven by loan growth in Card
Services and changes in specific macroeconomic factors, largely offset
by reduced borrower uncertainty
KEY DRIVERS / STATISTICS ($B) - DETAIL BY BUSINESS
2Q23
FR impact
Third-party mortgage loans serviced (EOP)
Net charge-off/(recovery) rate
Card Services & Auto
Card Services average loans
Auto average loans and leased assets
Auto loan and lease originations
Card Services net charge-off rate
Card Services net revenue rate
Card Services sales volume 5
Reported
$19.6
1.3
892.9
2.83%
$229.6
11.2
604.5
(0.05)%
$187.0
82.1
12.0
2.41%
9.11
$294.0
AWM Corp.
150.9
0.01%
$57.2
1.1
3.1
0.02%
ex. FR
$19.6
1.3
742.0
2.82%
$172.4
10.1
601.4
(0.07)%
$187.0
82.1
12.0
2.41%
9.11
$294.0
ex. FR
1Q23
$19.9
1.0
690.8
2.78%
$172.1
5.7
575.9
(0.04)%
$180.5
80.3
9.2
2.07%
2Q22
$22.8
1.2
628.5
1.31%
$177.3
21.9
575.6
(0.16)%
$158.4
83.4
7.0
1.47%
10.38
9.59
$266.2 $271.2
01
5View entire presentation