Hanmi Financial Results Presentation Deck
Net Income
$18.6M
●
●
●
Diluted EPS
$0.61
➤
➤
ROAA
0.99%
(1) Non-GAAP financial measure; refer to the non-GAAP reconciliation slide
ROAE
9.70%
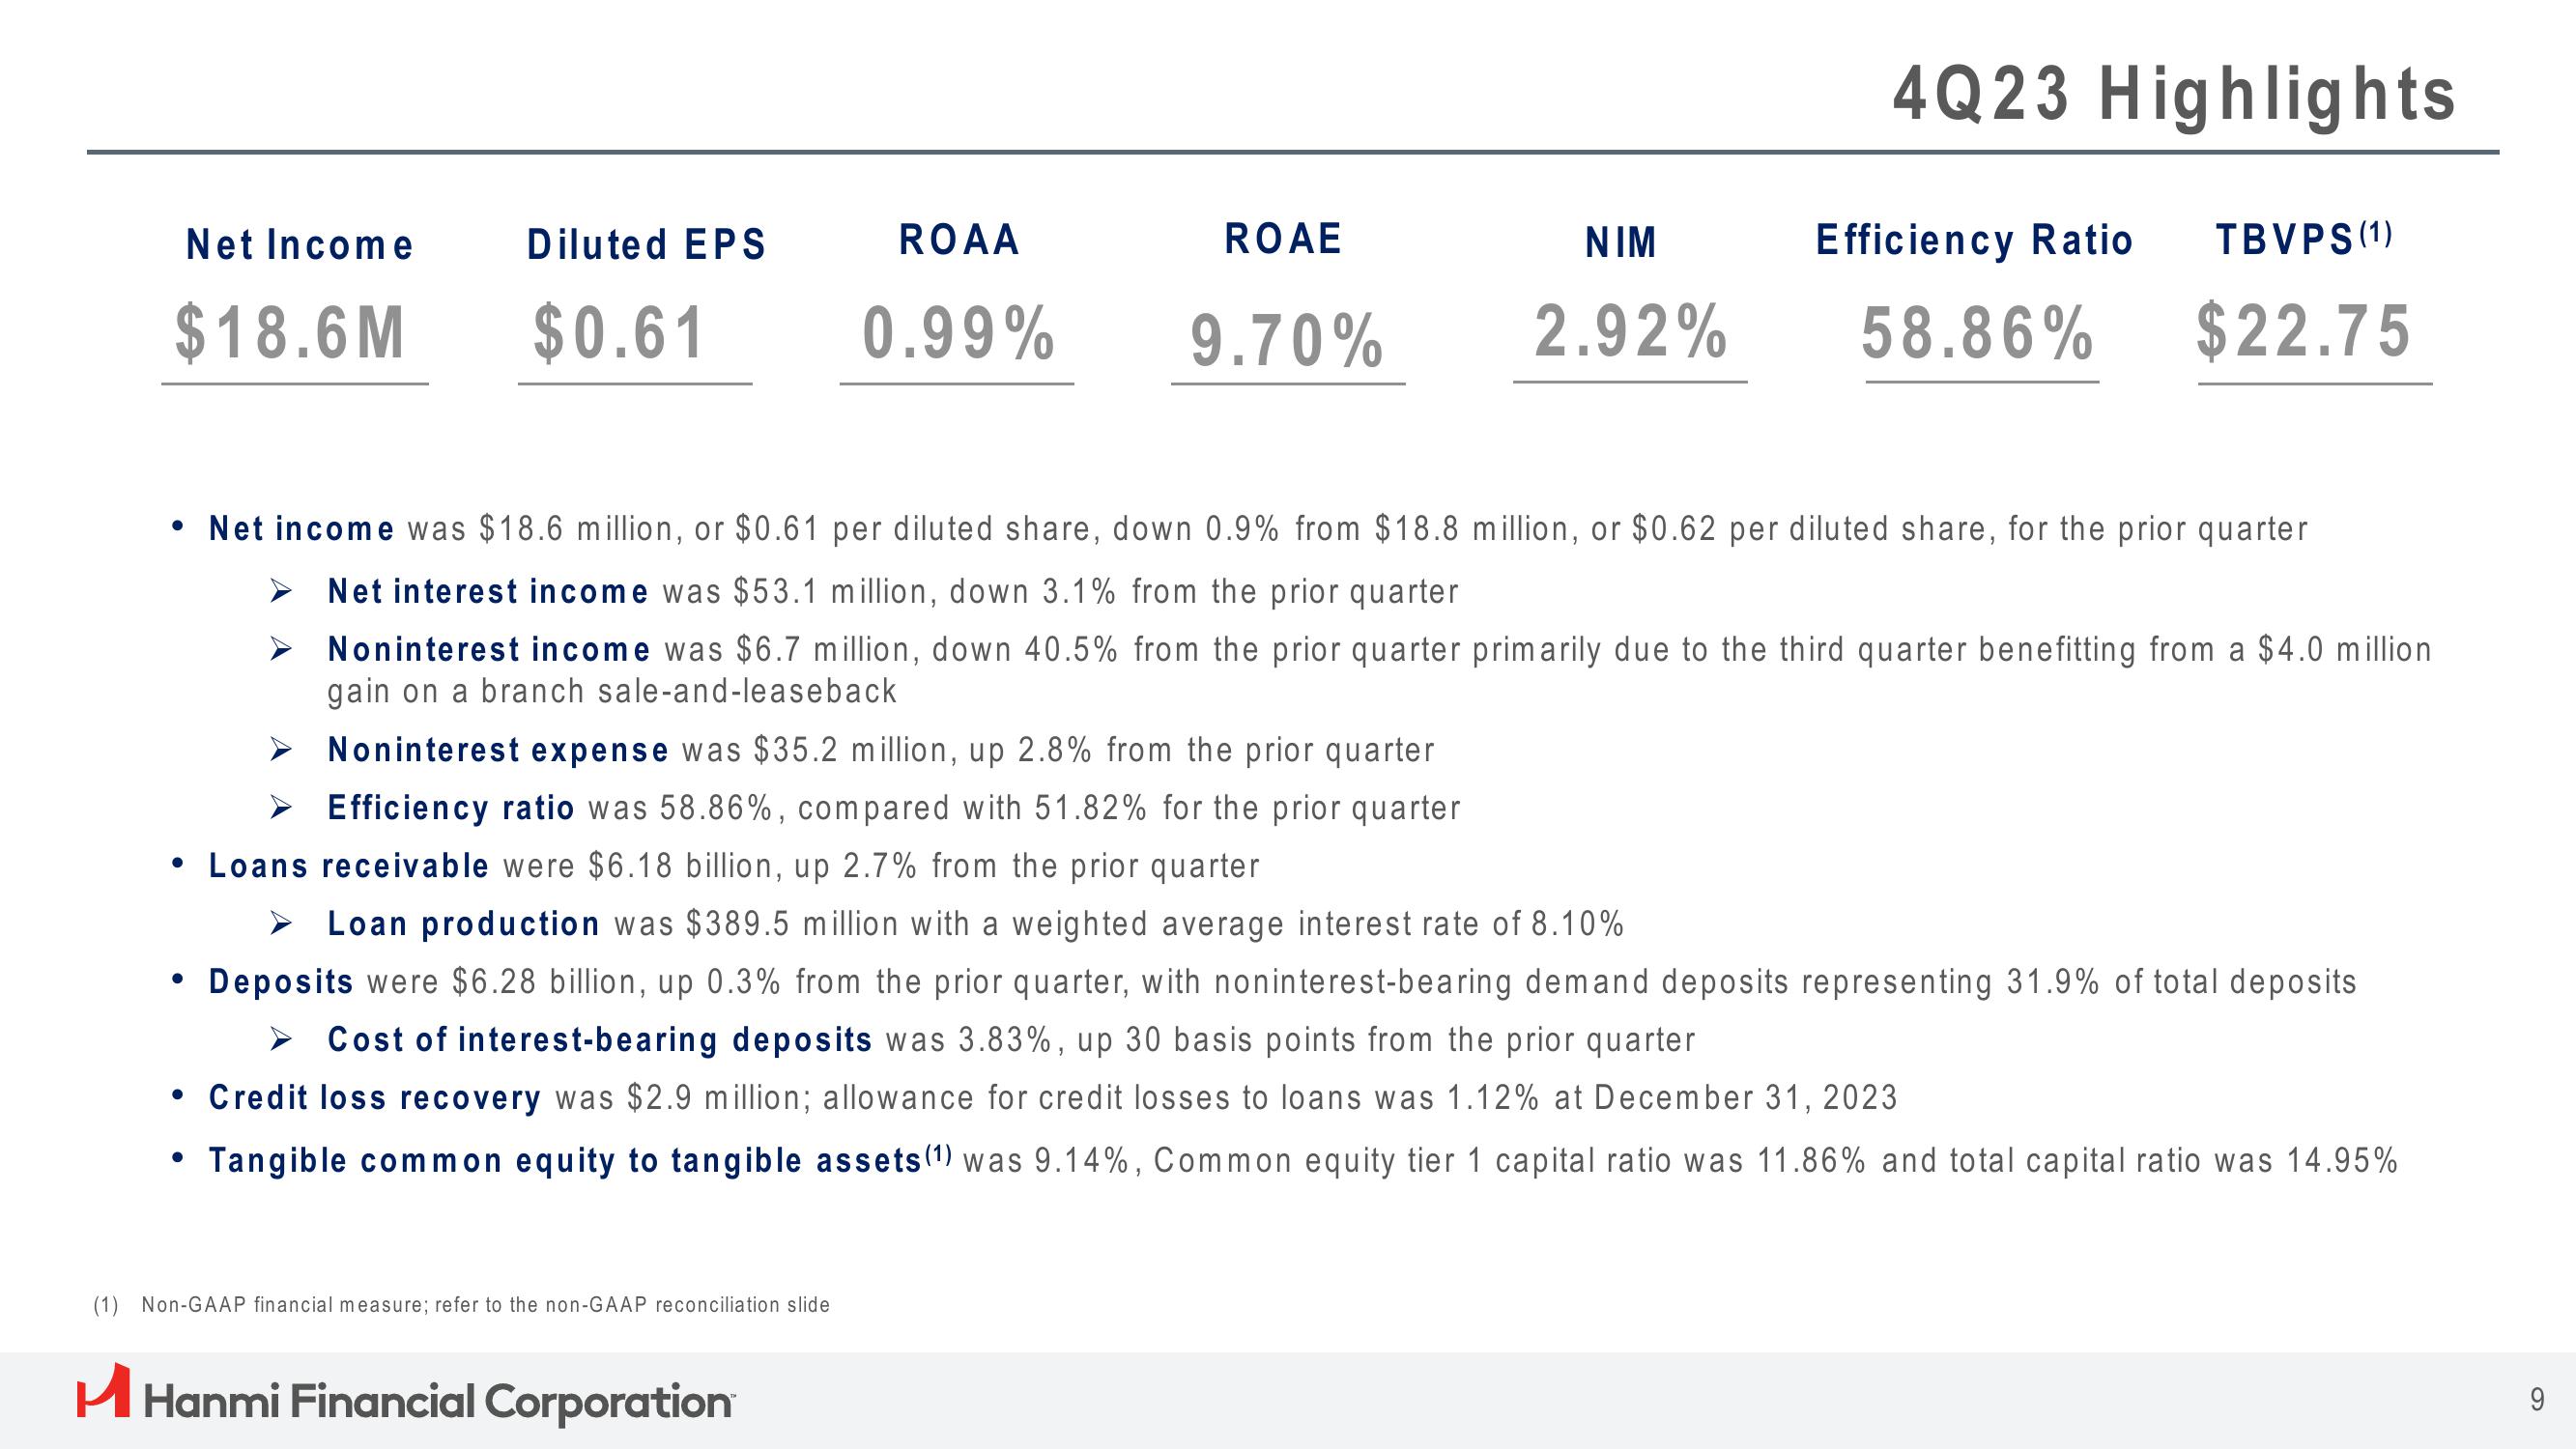
Net income was $18.6 million, or $0.61 per diluted share, down 0.9% from $18.8 million, or $0.62 per diluted share, for the prior quarter
Net interest income was $53.1 million, down 3.1% from the prior quarter
➤
Noninterest income was $6.7 million, down 40.5% from the prior quarter primarily due to the third quarter benefitting from a $4.0 million
gain on a branch sale-and-leaseback
Noninterest expense was $35.2 million, up 2.8% from the prior quarter
Efficiency ratio was 58.86%, compared with 51.82% for the prior quarter
• Loans receivable were $6.18 billion, up 2.7% from the prior quarter
➤ Loan production was $389.5 million with a weighted average interest rate of 8.10%
Deposits were $6.28 billion, up 0.3% from the prior quarter, with noninterest-bearing demand deposits representing 31.9% of total deposits
➤ Cost of interest-bearing deposits was 3.83%, up 30 basis points from the prior quarter
• Credit loss recovery was $2.9 million; allowance for credit losses to loans was 1.12% at December 31, 2023
Tangible common equity to tangible assets (1) was 9.14%, Common equity tier 1 capital ratio was 11.86% and total capital ratio was 14.95%
H Hanmi Financial Corporation
NIM
2.92%
4Q23 Highlights
Efficiency Ratio TBVPS (1)
$22.75
58.86%
9View entire presentation