Enact IPO Presentation Deck
Enact | Investor Presentation
Demonstrated attractive financial performance
relative to risk profile
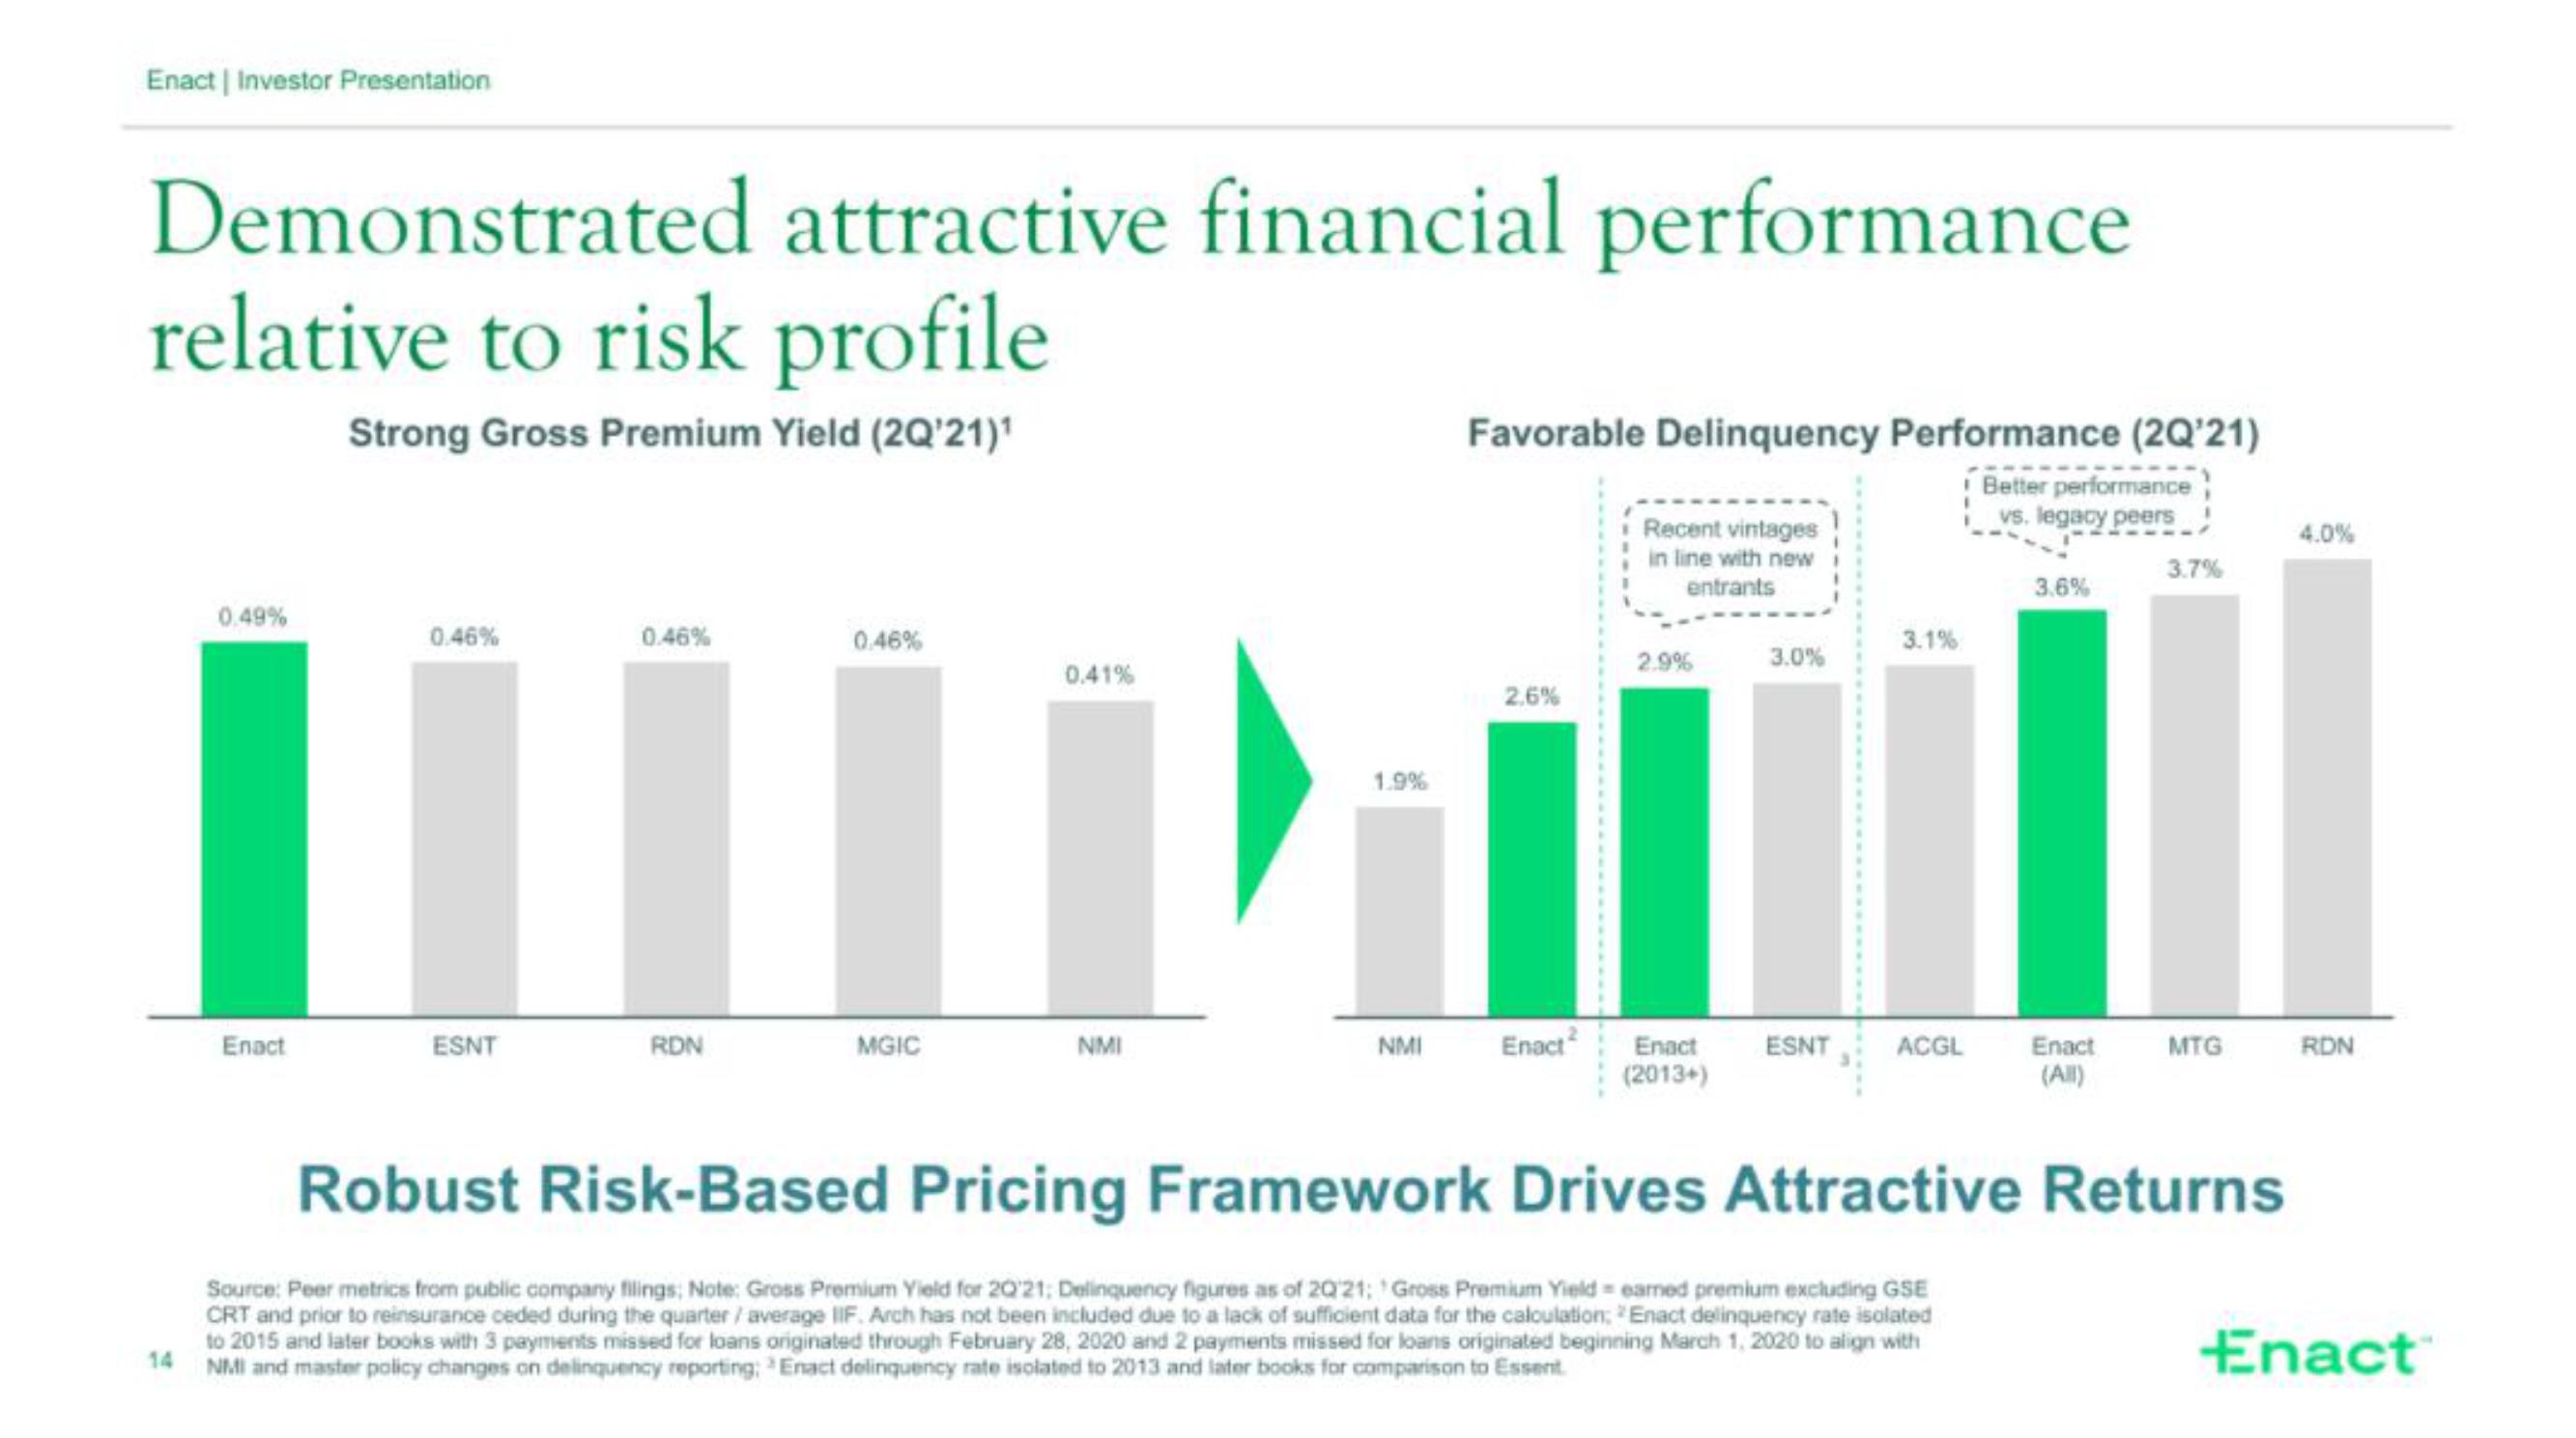
Strong Gross Premium Yield (2Q'21)¹
0.49%
Enact
0.46%
ESNT
0.46%
RDN
0.46%
MGIC
0.41%
NMI
1.9%
NMI
Favorable Delinquency Performance (2Q'21)
Better performance
vs. legacy peers
2.6%
Enact
Recent vintages
in line with new
entrants
2.9%
Enact
(2013+)
3.0%
3.1%
ESNT ACGL
3.6%
Source: Peer metrics from public company filings; Note: Gross Premium Yield for 20'21; Delinquency figures as of 20'21; Gross Premium Yield eamed premium excluding GSE
CRT and prior to reinsurance ceded during the quarter / average IIF. Arch has not been included due to a lack of sufficient data for the calculation, Enact delinquency rate isolated
to 2015 and later books with 3 payments missed for loans originated through February 28, 2020 and 2 payments missed for loans originated beginning March 1, 2020 to align with
14 NMI and master policy changes on delinquency reporting: Enact delinquency rate isolated to 2013 and later books for comparison to Essent
Enact
(All)
3.7%
MTG
Robust Risk-Based Pricing Framework Drives Attractive Returns
4.0%
RDN
EnactView entire presentation