WeWork Results Presentation Deck
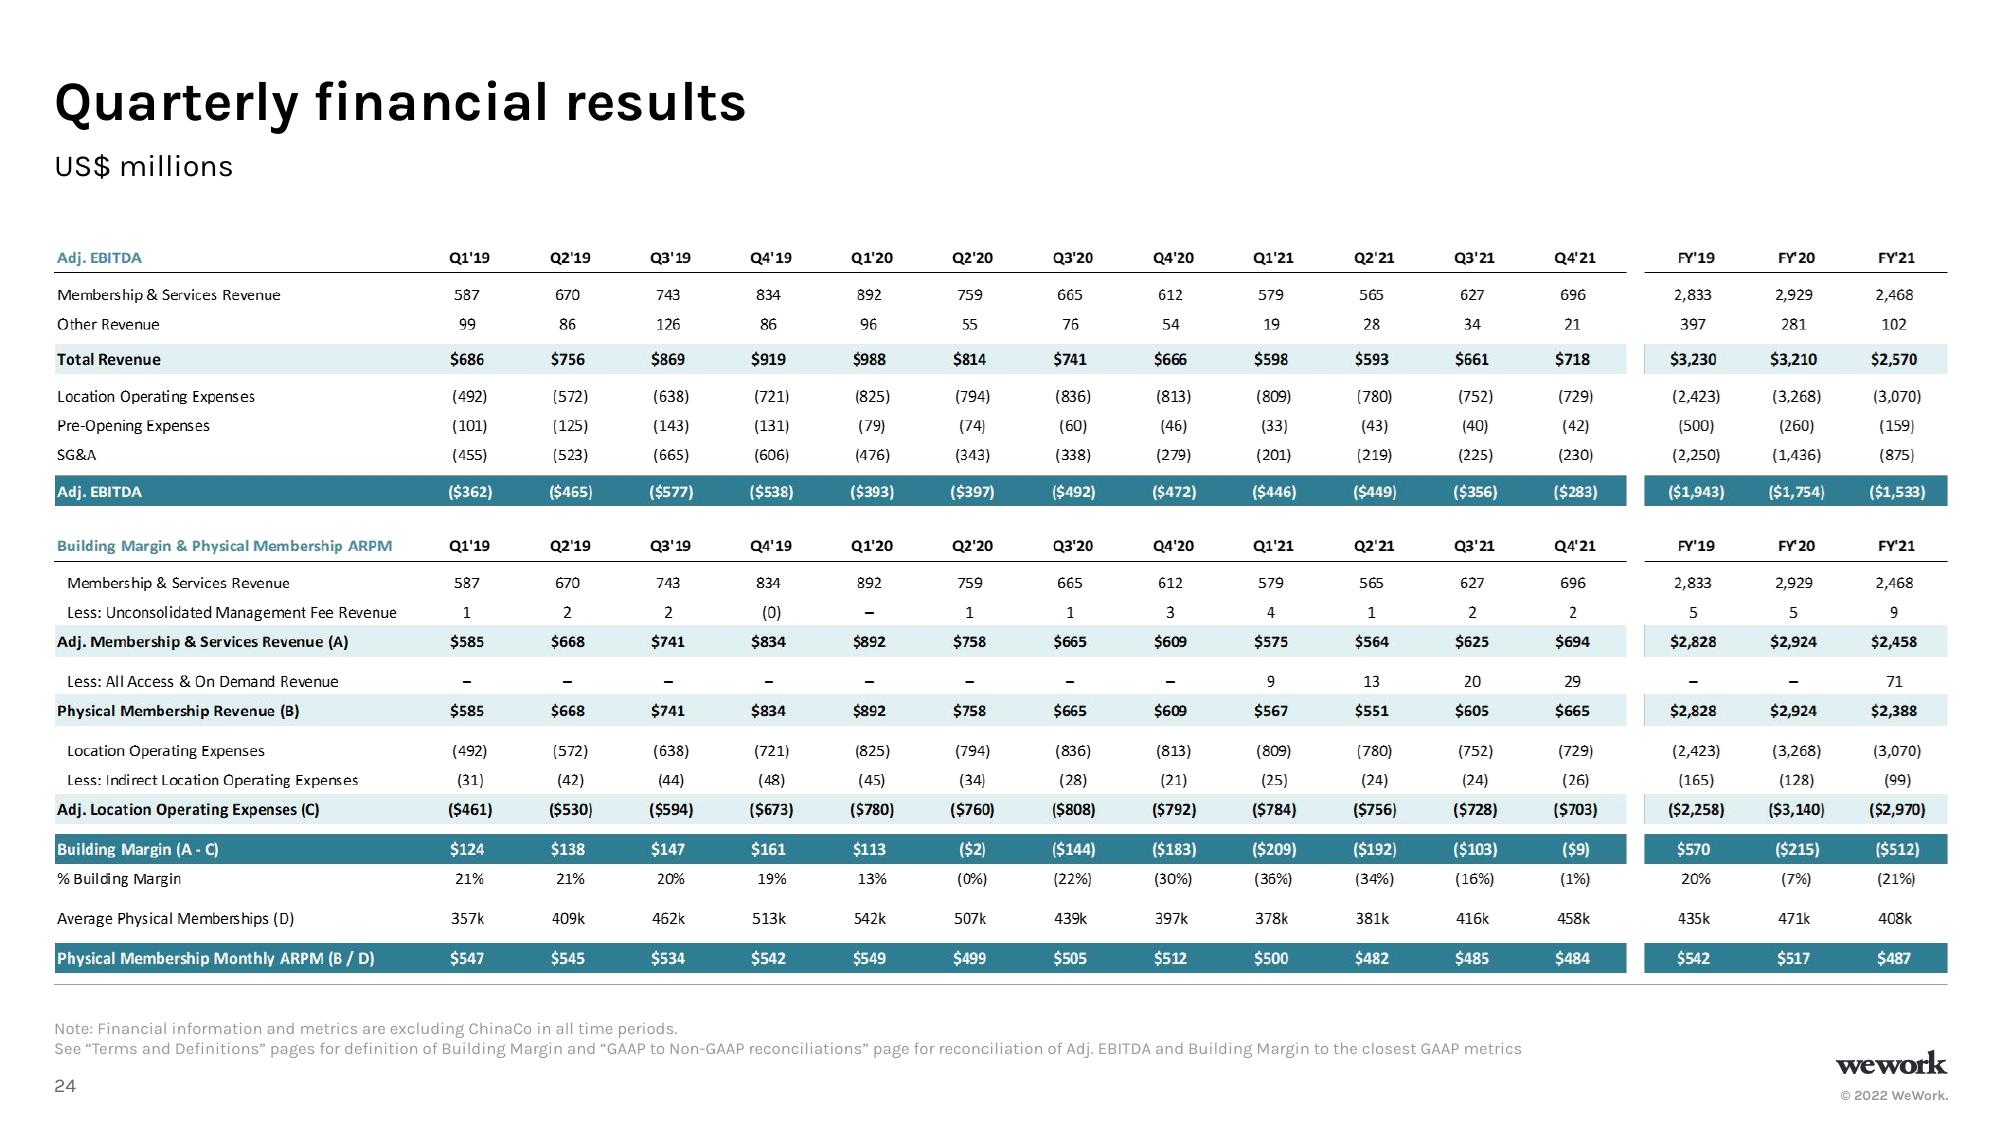
Quarterly financial results
US$ millions
Adj. EBITDA
Membership & Services Revenue
Other Revenue
Total Revenue
Location Operating Expenses
Pre-Opening Expenses
SG&A
Adj. EBITDA
Building Margin & Physical Membership ARPM
Membership & Services Revenue
Less: Unconsolidated Management Fee Revenue
Adj. Membership & Services Revenue (A)
Less: All Access & On Demand Revenue
Physical Membership Revenue (B)
Location Operating Expenses
Less: Indirect Location Operating Expenses
Adj. Location Operating Expenses (C)
Building Margin (A - C)
% Building Margin
Average Physical Memberships (D)
Physical Membership Monthly ARPM (B/ D)
Q1'19
587
99
$686
(492)
(101)
(455)
($362)
Q1'19
587
1
$585
$585
(492)
(31)
($461)
$124
21%
357k
$547
Q2'19
670
86
$756
(572)
(125)
(523)
($465)
Q2'19
670
2
$668
$668
(572)
(42)
($530)
$138
21%
409k
$545
Q3'19
743
126
$869
(638)
(143)
(665)
($577)
Q3'19
743
2
$741
$741
(638)
(44)
($594)
$147
20%
462k
$534
Q4'19
834
86
$919
(721)
(131)
(606)
($538)
Q4'19
834
(0)
$834
$834
(721)
(48)
($673)
$161
19%
513k
$542
Q1'20
892
96
$988
(825)
(79)
(476)
($393)
Q1'20
892
$892
-
$892
(825)
(45)
($780)
$113
13%
542k
$549
Q2'20
759
55
$814
(794)
(74)
(343)
($397)
Q2'20
759
1
$758
$758
(794)
(34)
($760)
($2)
(0%)
507k
$499
Q3'20
665
76
$741
(836)
(60)
(338)
($492)
Q3'20
665
1
$665
$665
(836)
(28)
($808)
($144)
(22%)
439k
$505
Q4'20
612
54
$666
(813)
(46)
(279)
($472)
Q4'20
612
3
$609
-
$609
(813)
(21)
($792)
($183)
(30%)
397k
$512
Q1'21
579
19
$598
(809)
(33)
(201)
($446)
Q1'21
579
4
$575
9
$567
(809)
(25)
($784)
($209)
(36%)
378k
$500
Q2'21
565
28
$593
(780)
(43)
(219)
($449)
Q2'21
565
1
$564
13
$551
(780)
(24)
($756)
($192)
(34%)
381k
$482
Q3'21
627
34
$661
(752)
(40)
(225)
($356)
Q3'21
627
2
$625
20
$605
(752)
(24)
($728)
($103)
(16%)
416k
$485
Note: Financial information and metrics are excluding ChinaCo in all time periods.
See "Terms and Definitions" pages for definition of Building Margin and "GAAP to Non-GAAP reconciliations" page for reconciliation of Adj. EBITDA and Building Margin to the closest GAAP metrics
24
Q4'21
696
21
$718
(729)
(42)
(230)
($283)
Q4'21
696
2
$694
29
$665
(729)
(26)
($703)
($9)
(1%)
458k
$484
FY'19
2,833
397
$3,230
(2,423)
(500)
(2,250)
($1,943)
FY'19
2,833
5
$2,828
$2,828
(2,423)
(165)
($2,258)
$570
20%
435k
$542
FY' 20
2,929
281
$3,210
(3,268)
(260)
(1,436)
($1,754)
FY' 20
2,929
5
$2,924
$2,924
(3,268)
(128)
($3,140)
($215)
(7%)
471k
$517
FY'21
2,468
102
$2,570
(3,070)
(159)
(875)
($1,533)
FY¹21
2,468
9
$2,458
71
$2,388
(3,070)
(99)
($2,970)
($512)
(21%)
408k
$487
wework
Ⓒ2022 WeWork.View entire presentation