Q2 Quarter 2023
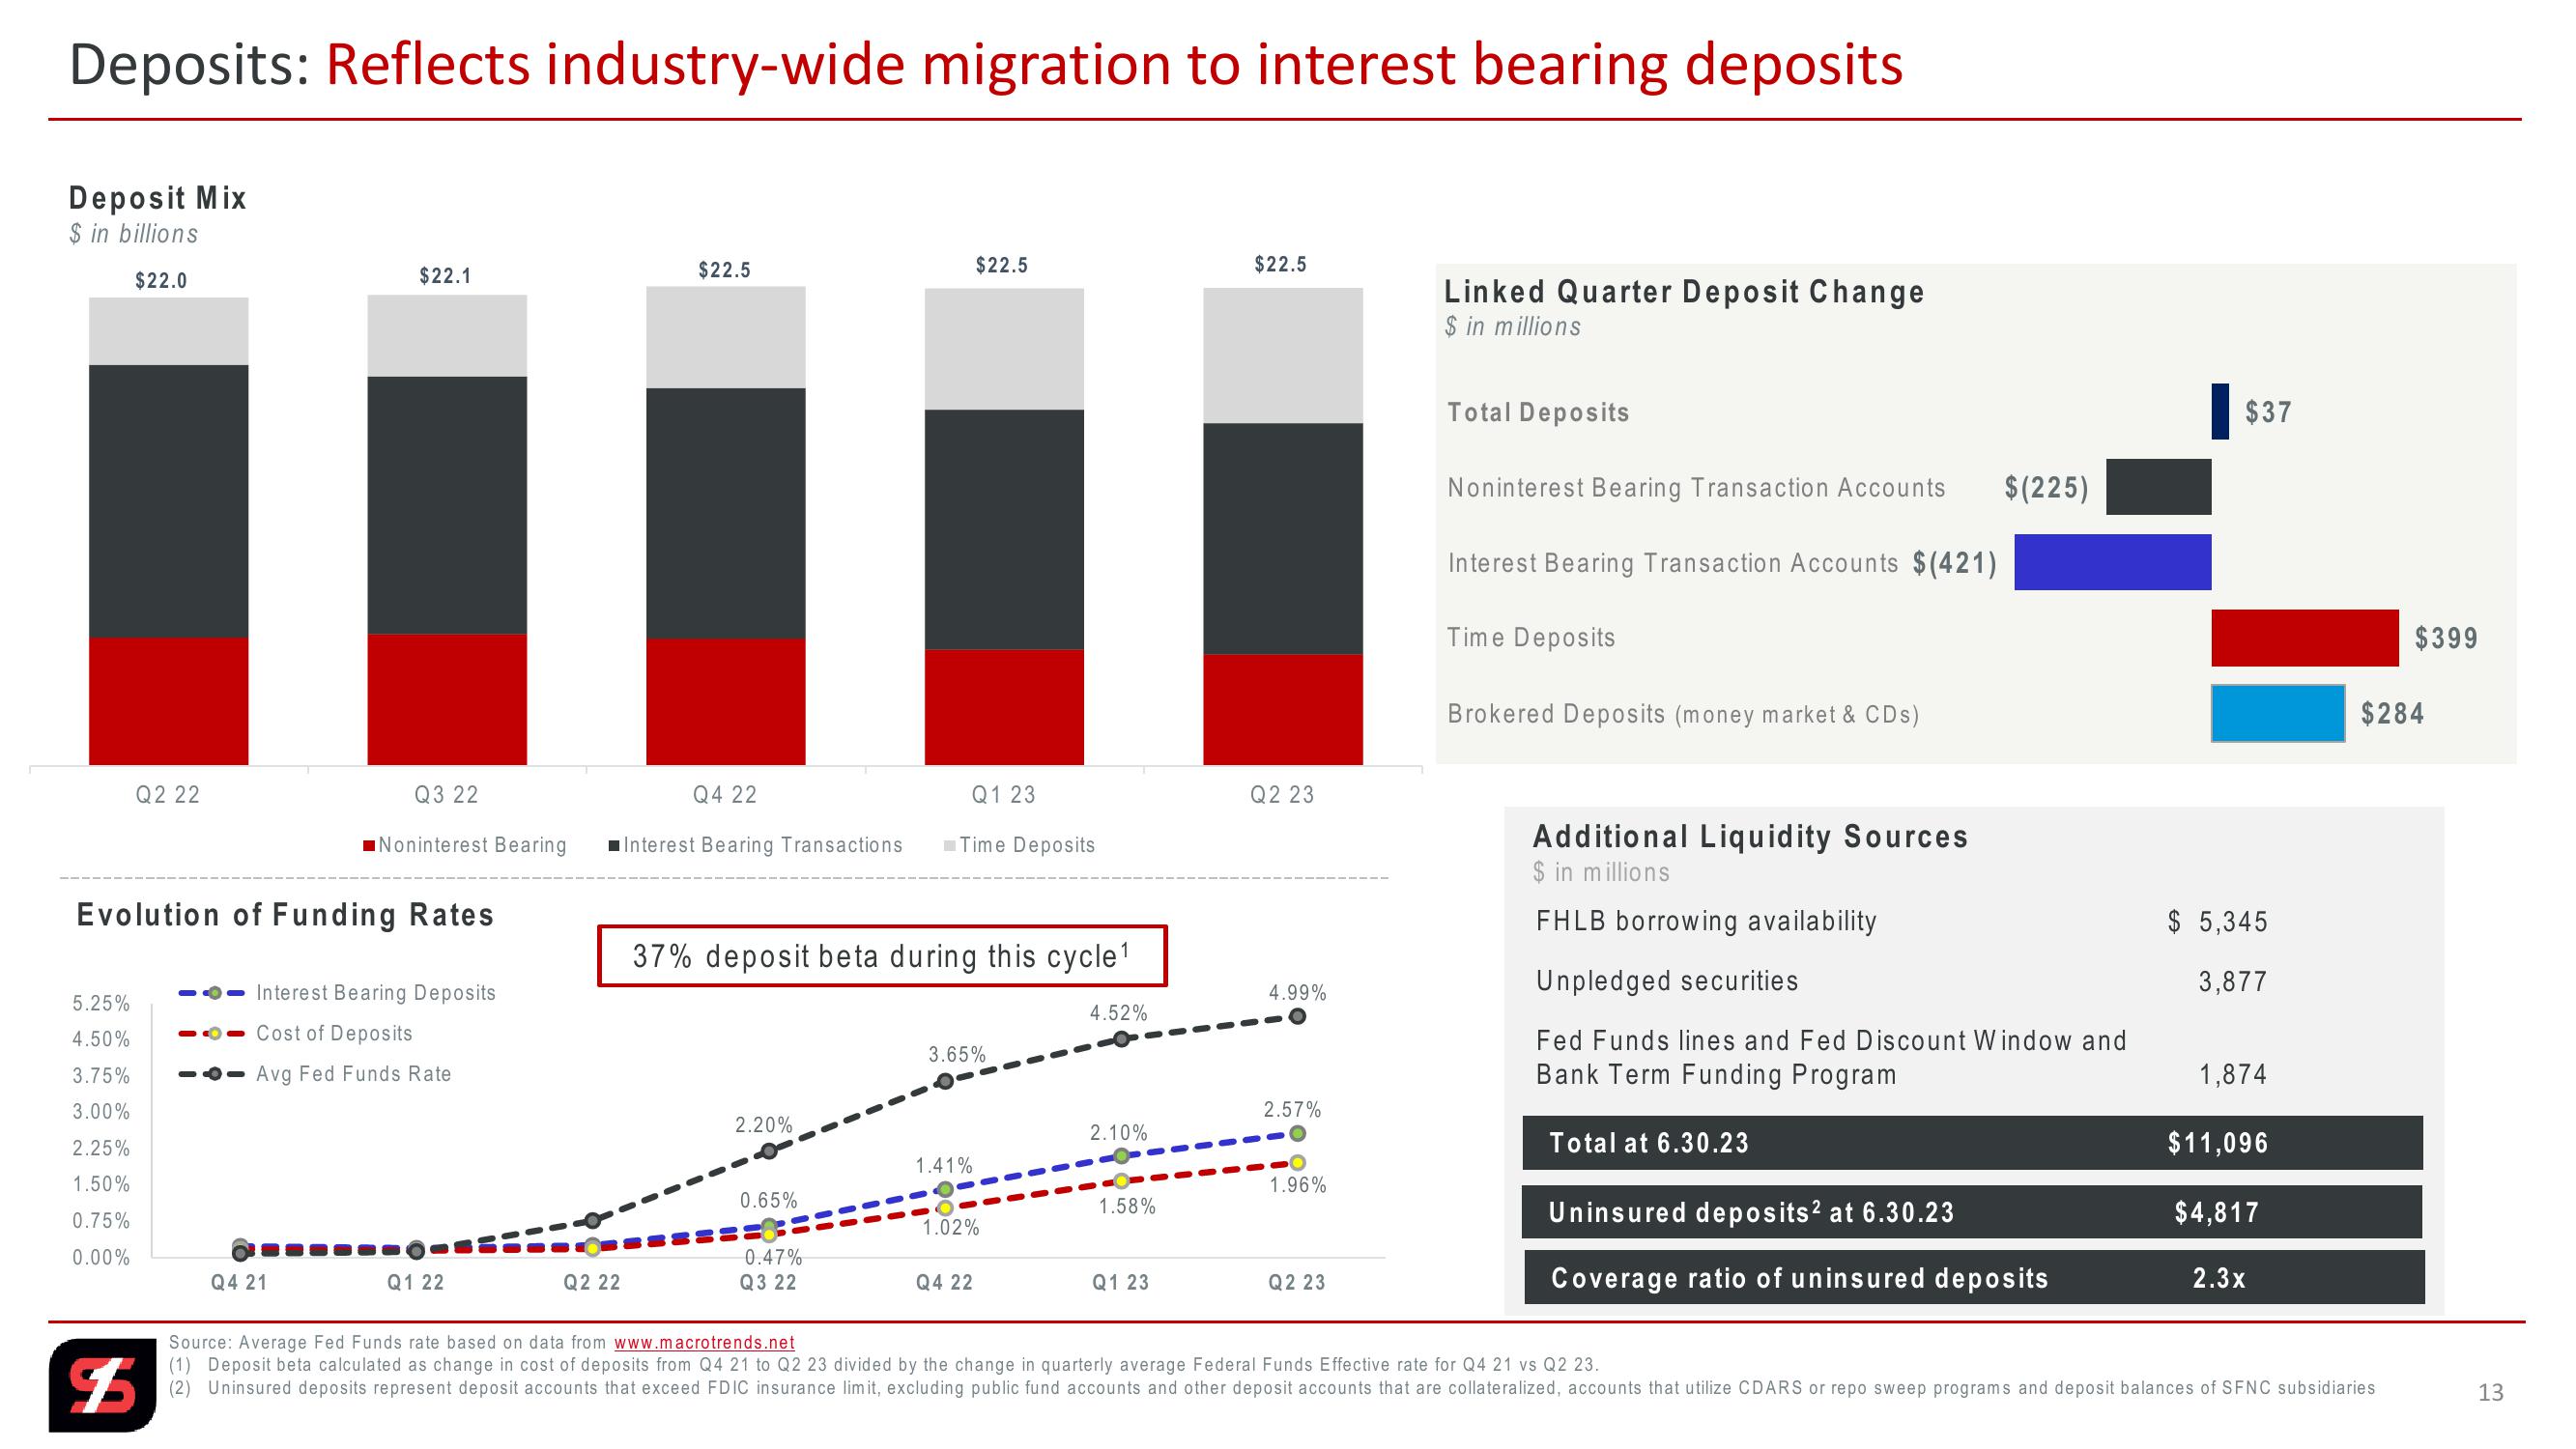
Deposits: Reflects industry-wide migration to interest bearing deposits
Deposit Mix
$ in billions
$22.0
$22.1
$22.5
$22.5
$22.5
Linked Quarter Deposit Change
$ in millions
Total Deposits
$37
Noninterest Bearing Transaction Accounts
$(225)
Interest Bearing Transaction Accounts $(421)
Time Deposits
Brokered Deposits (money market & CDs)
Q2 22
Q3 22
■Noninterest Bearing
Q4 22
Q1 23
Q2 23
■Interest Bearing Transactions ■Time Deposits
Evolution of Funding Rates
37% deposit beta during this cycle¹
5.25%
Interest Bearing Deposits
4.99%
Additional Liquidity Sources
$ in millions
FHLB borrowing availability
$ 5,345
Unpledged securities
3,877
4.52%
4.50%
Cost of Deposits
3.75%
Avg Fed Funds Rate
3.00%
2.25%
1.50%
0.75%
0.00%
Q4 21
Q1 22
Q2 22
3.65%
Fed Funds lines and Fed Discount Window and
Bank Term Funding Program
2.20%
2.57%
2.10%
Total at 6.30.23
1.41%
1.96%
0.65%
1.58%
1.02%
Uninsured deposits² at 6.30.23
0.47%
Q3 22
Q4 22
Q1 23
Q2 23
1,874
$11,096
$4,817
Coverage ratio of uninsured deposits
2.3x
$5
$399
$284
Source: Average Fed Funds rate based on data from www.macrotrends.net
(1) Deposit beta calculated as change in cost of deposits from Q4 21 to Q2 23 divided by the change in quarterly average Federal Funds Effective rate for Q4 21 vs Q2 23.
(2) Uninsured deposits represent deposit accounts that exceed FDIC insurance limit, excluding public fund accounts and other deposit accounts that are collateralized, accounts that utilize CDARS or repo sweep programs and deposit balances of SFNC subsidiaries
13View entire presentation