Forge SPAC Presentation Deck
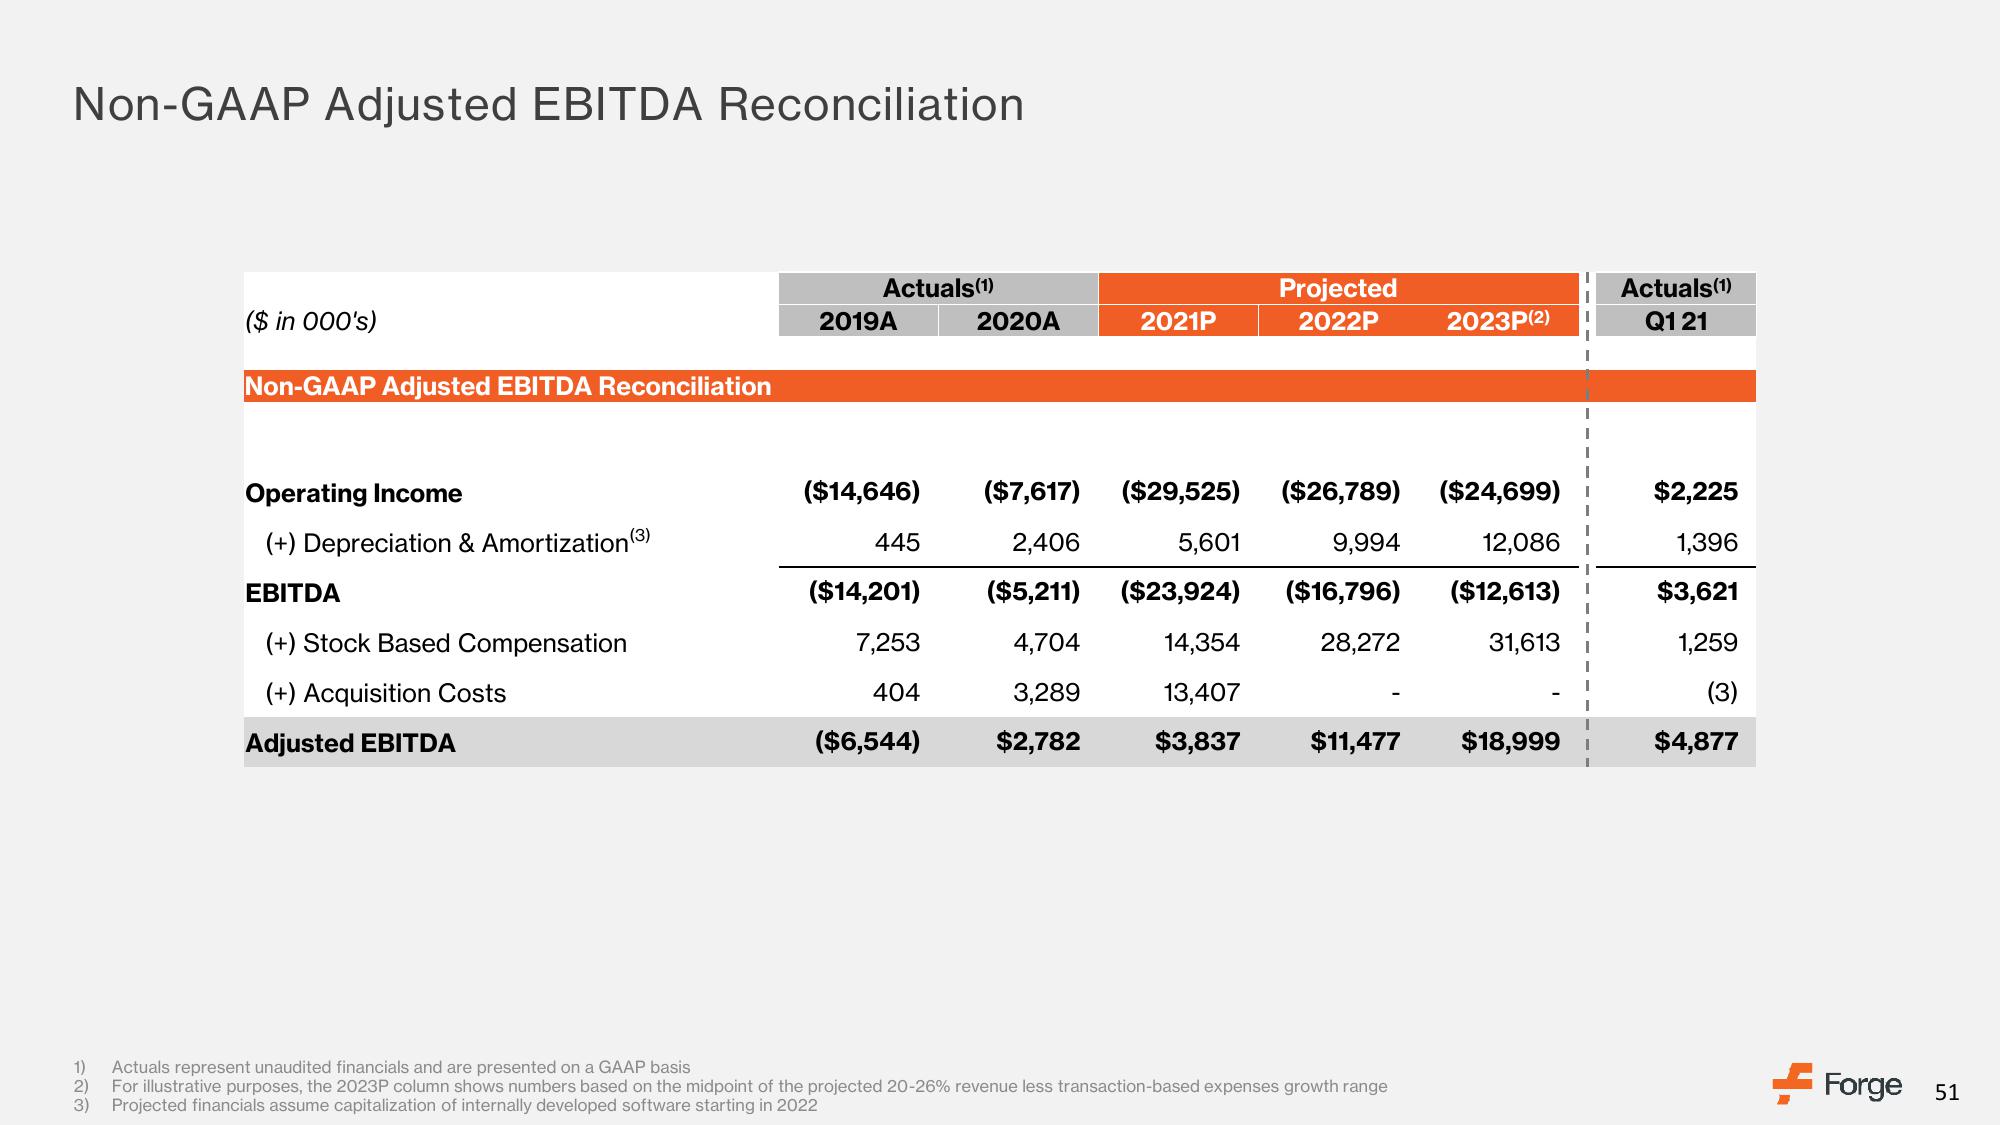
Non-GAAP Adjusted EBITDA Reconciliation
($ in 000's)
Non-GAAP Adjusted EBITDA Reconciliation
Operating Income
(+) Depreciation & Amortization (3)
EBITDA
(+) Stock Based Compensation
(+) Acquisition Costs
Adjusted EBITDA
Actuals (1)
2019A
($14,646)
445
($14,201)
7,253
404
($6,544)
2020A
2021P
Projected
2022P
($7,617) ($29,525)
($26,789)
9,994
2,406
5,601
($5,211) ($23,924) ($16,796)
28,272
4,704
3,289
14,354
13,407
$2,782
$3,837 $11,477
1) Actuals represent unaudited financials and are presented on a GAAP basis
2)
For illustrative purposes, the 2023P column shows numbers based on the midpoint of the projected 20-26% revenue less transaction-based expenses growth range
3) Projected financials assume capitalization of internally developed software starting in 2022
2023P(2)
($24,699)
12,086
($12,613)
31,613 i
$18,999
Actuals (1)
Q1 21
$2,225
1,396
$3,621
1,259
(3)
$4,877
Forge 51View entire presentation