Dutch Bros Results Presentation Deck
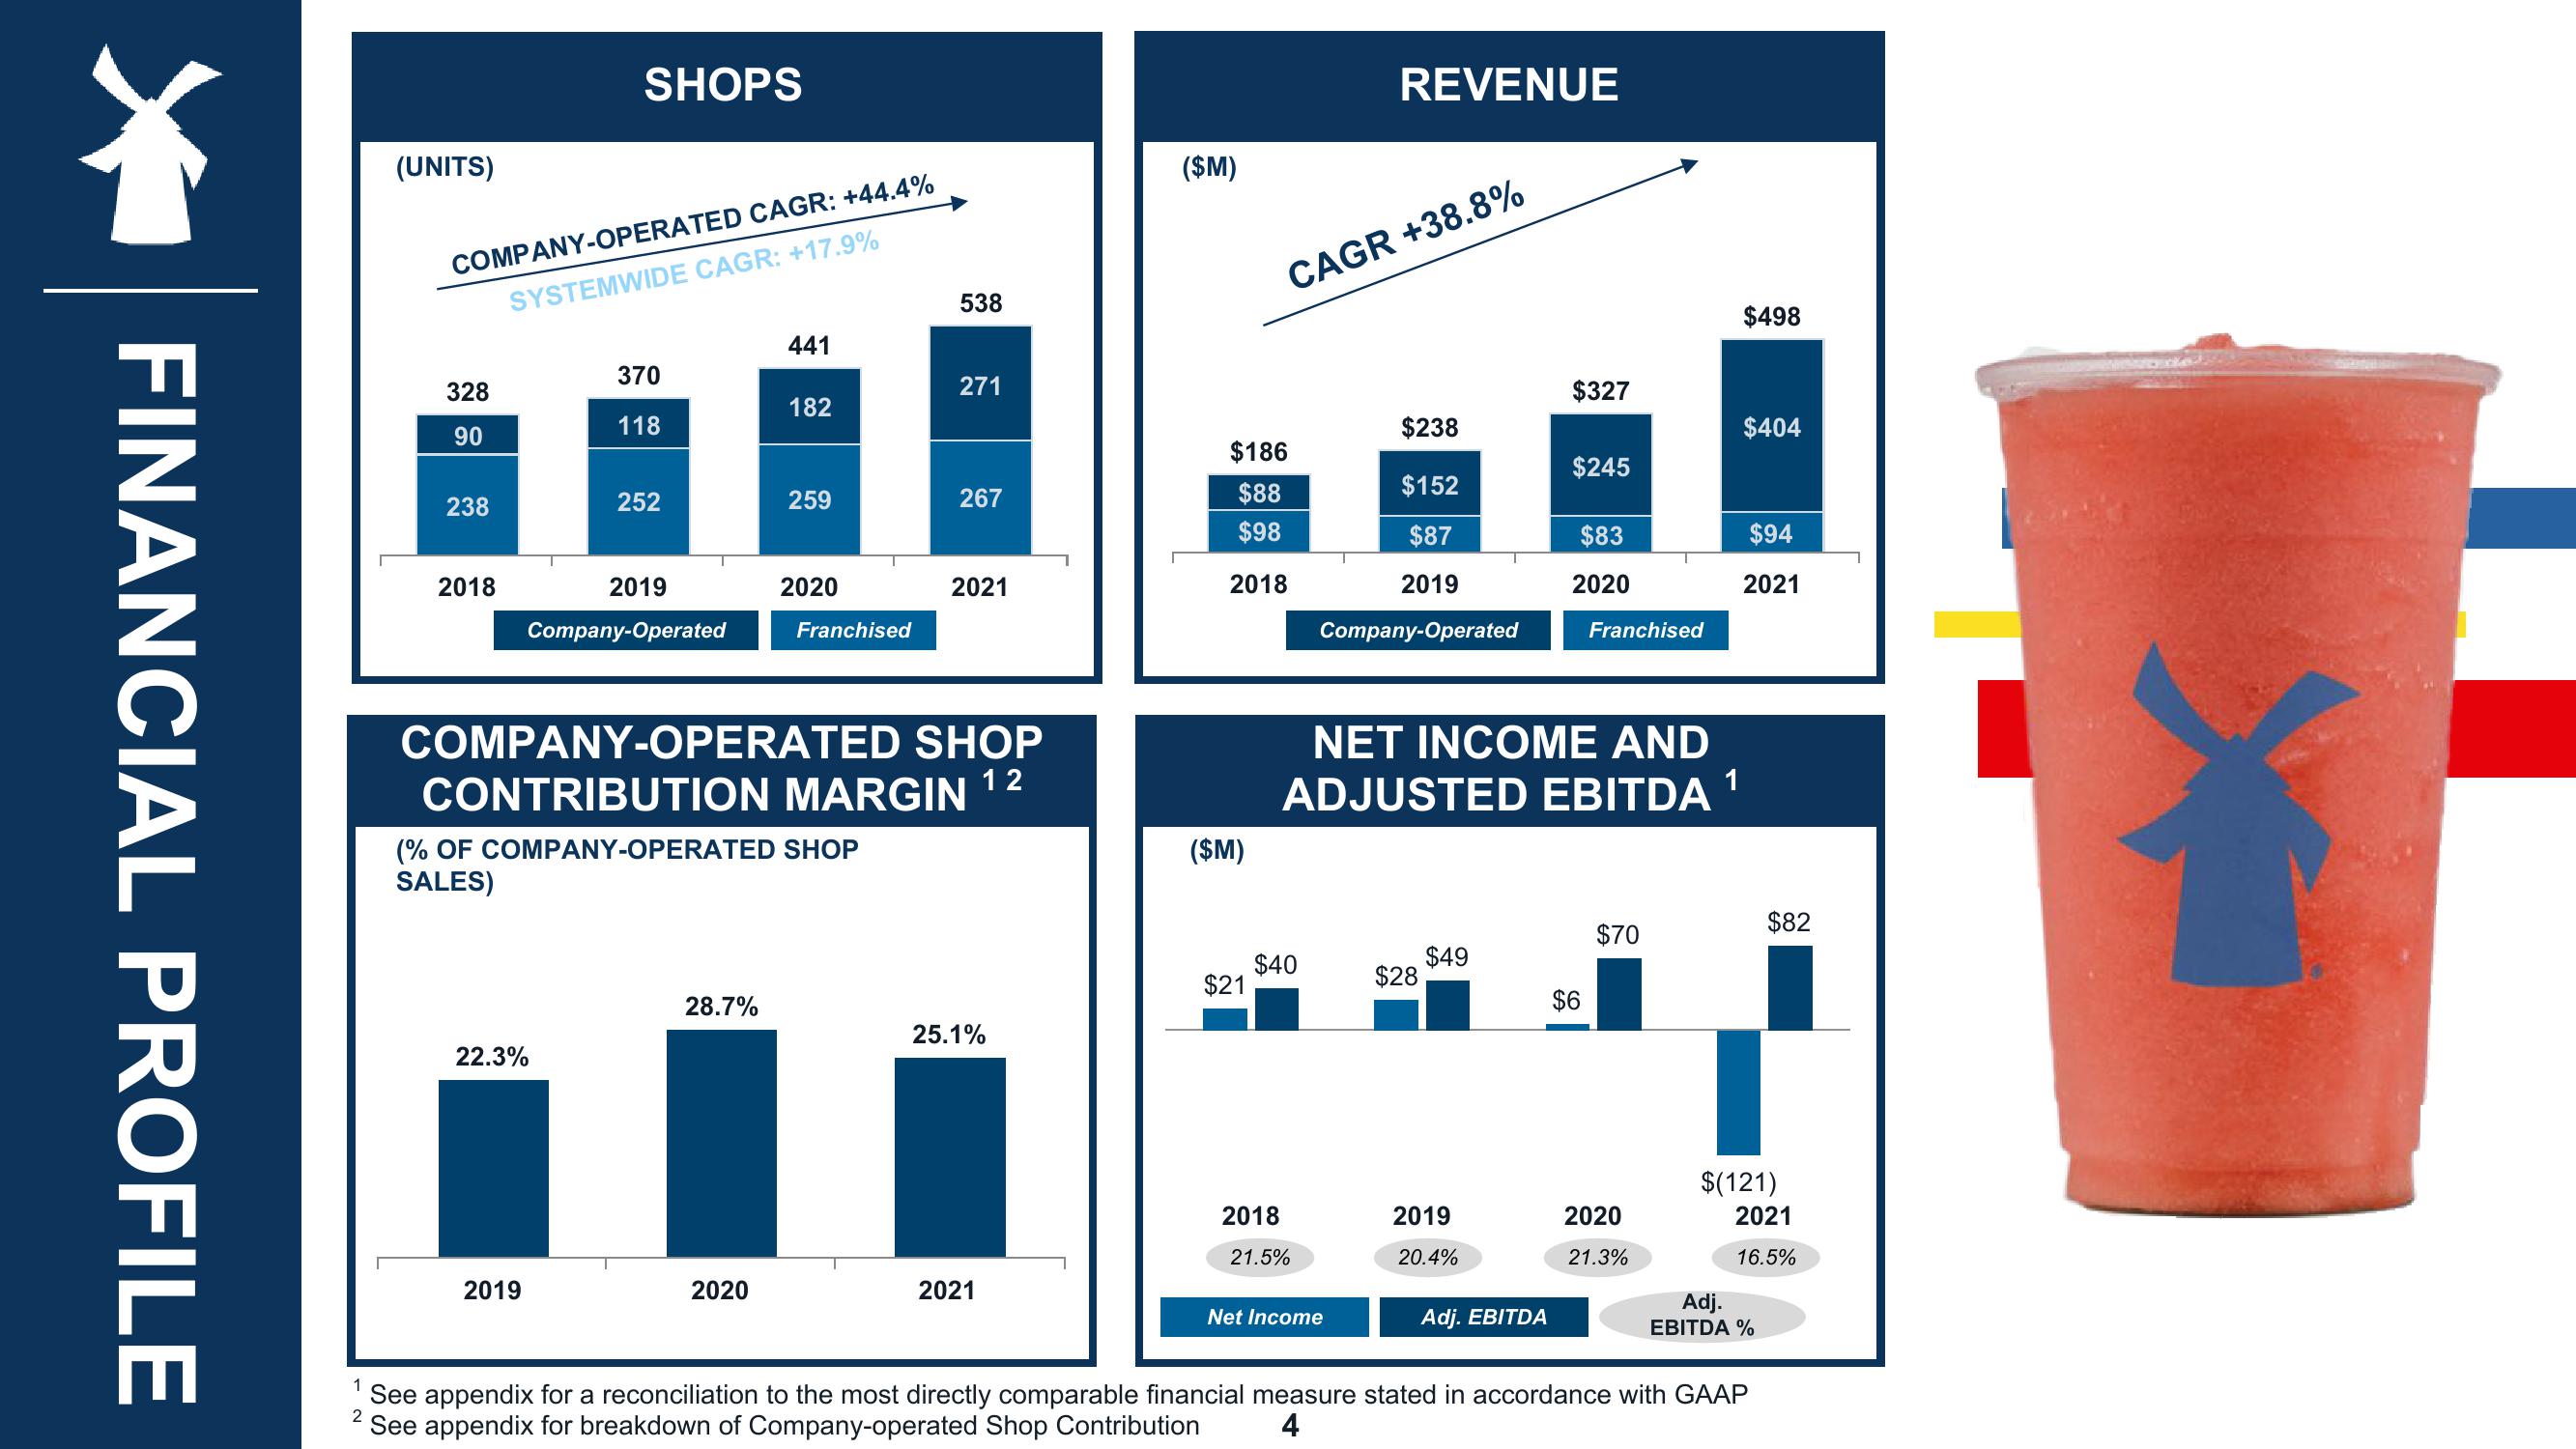
FINANCIAL PROFILE
(UNITS)
COMPANY-OPERATED CAGR: +44.4%
SYSTEMWIDE CAGR: +17.9%
328
90
238
2018
SHOPS
22.3%
2019
370
118
252
2019
Company-Operated
28.7%
441
2020
182
259
2020
Franchised
538
COMPANY-OPERATED SHOP
CONTRIBUTION MARGIN
12
(% OF COMPANY-OPERATED SHOP
SALES)
271
267
2021
25.1%
2021
($M)
$186
$88
$98
2018
($M)
$21
CAGR +38.8%
$40
REVENUE
2018
21.5%
$238
$152
$87
2019
Company-Operated
Net Income
NET INCOME AND
ADJUSTED EBITDA ¹
$28
$49
2019
20.4%
$327
Adj. EBITDA
$245
$83
2020
Franchised
$6
$70
2020
21.3%
$498
$404
$94
2021
$(121)
$82
2021
16.5%
Adj.
EBITDA %
1
2
See appendix for a reconciliation to the most directly comparable financial measure stated in accordance with GAAP
See appendix for breakdown of Company-operated Shop Contribution 4
*View entire presentation