Zegna Investor Presentation Deck
SUMMARY NON-IFRS CORE FINANCIALS (2/2)
€m
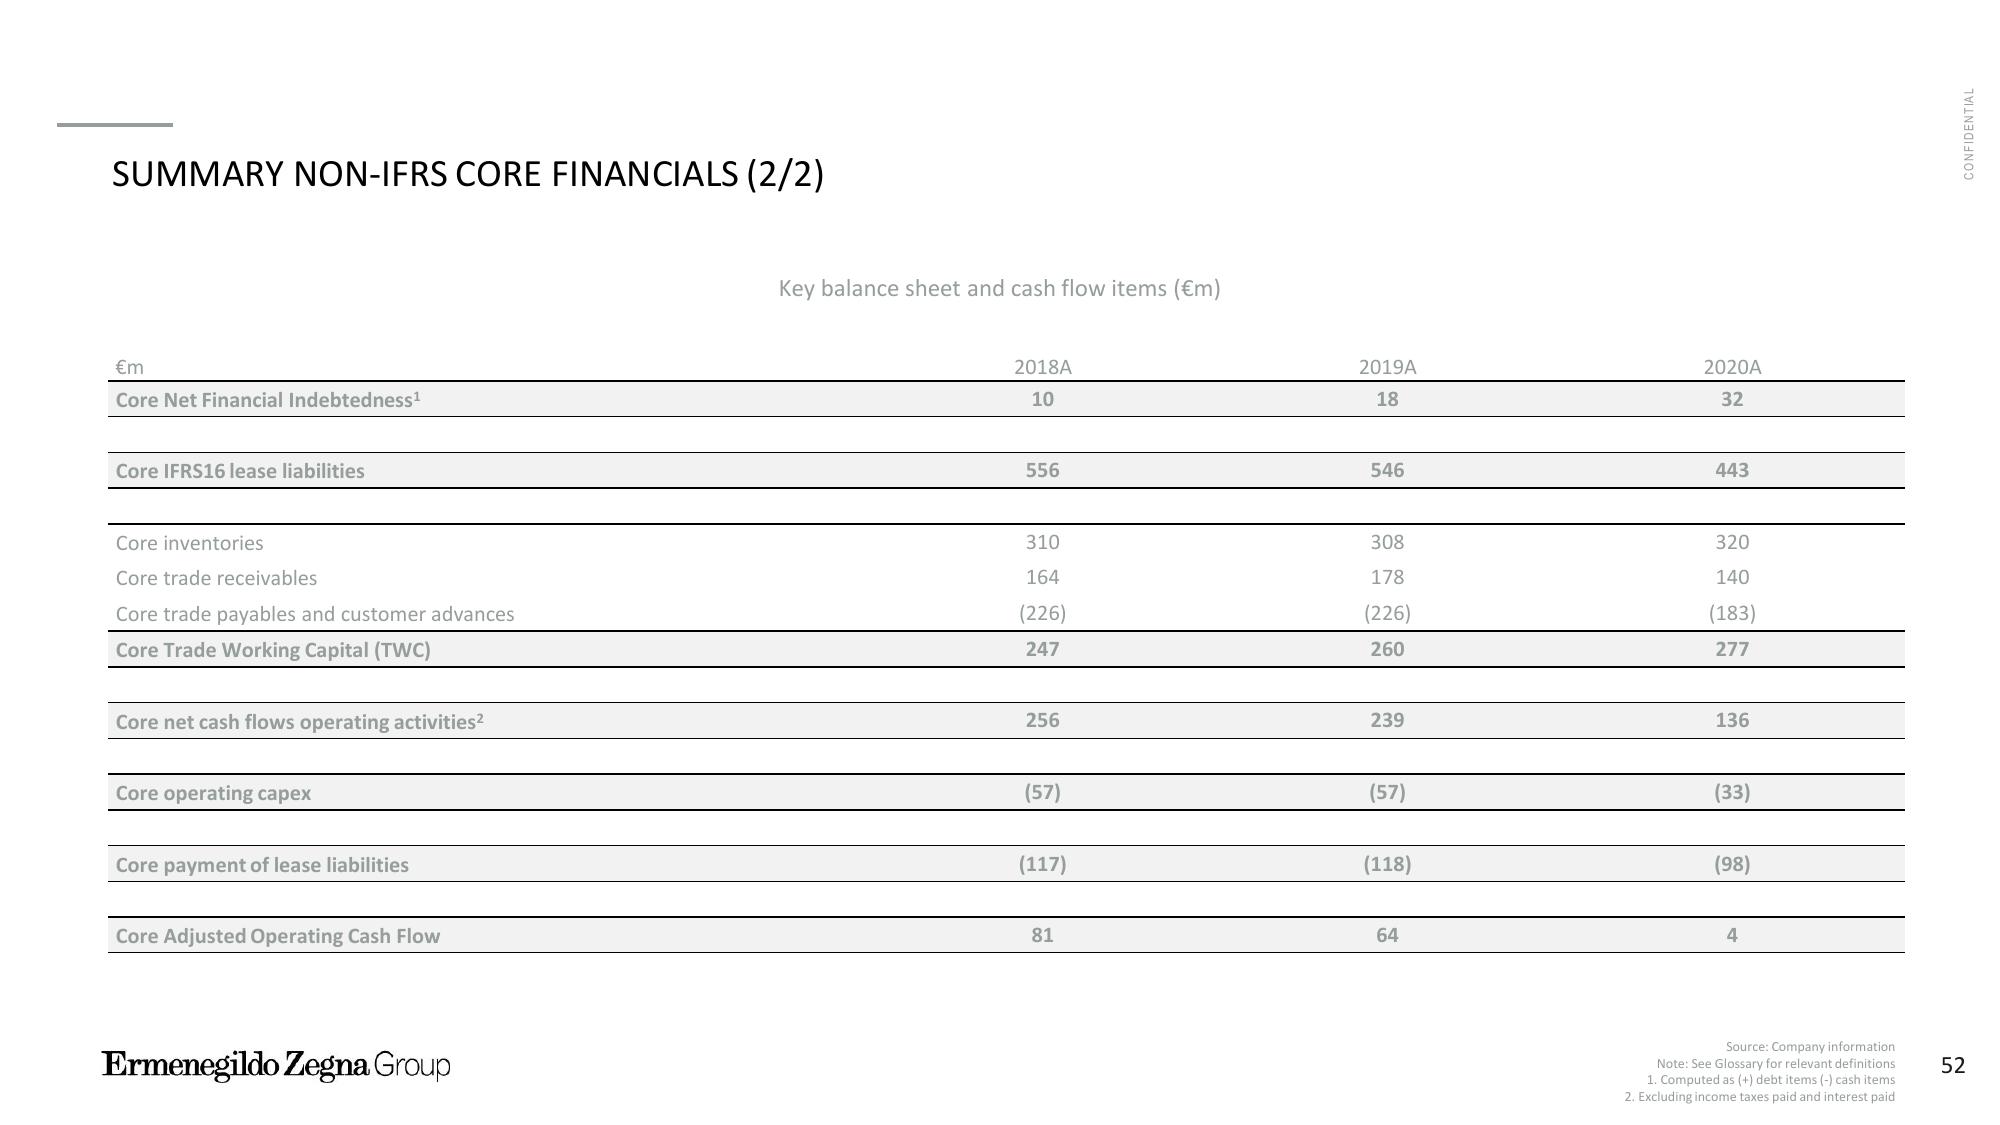
Core Net Financial Indebtedness¹
Core IFRS16 lease liabilities
Core inventories
Core trade receivables
Core trade payables and customer advances
Core Trade Working Capital (TWC)
Core net cash flows operating activities²
Core operating capex
Core payment of lease liabilities
Core Adjusted Operating Cash Flow
Ermenegildo Zegna Group
Key balance sheet and cash flow items (€m)
2018A
10
556
310
164
(226)
247
256
(57)
(117)
81
2019A
18
546
308
178
(226)
260
239
(57)
(118)
64
2020A
32
443
320
140
(183)
277
136
(33)
(98)
4
Source: Company information
Note: See Glossary for relevant definitions
1. Computed as (+) debt items (-) cash items
2. Excluding income taxes paid and interest paid
CONFIDENTIAL
52View entire presentation