Bill.com Investor Presentation Deck
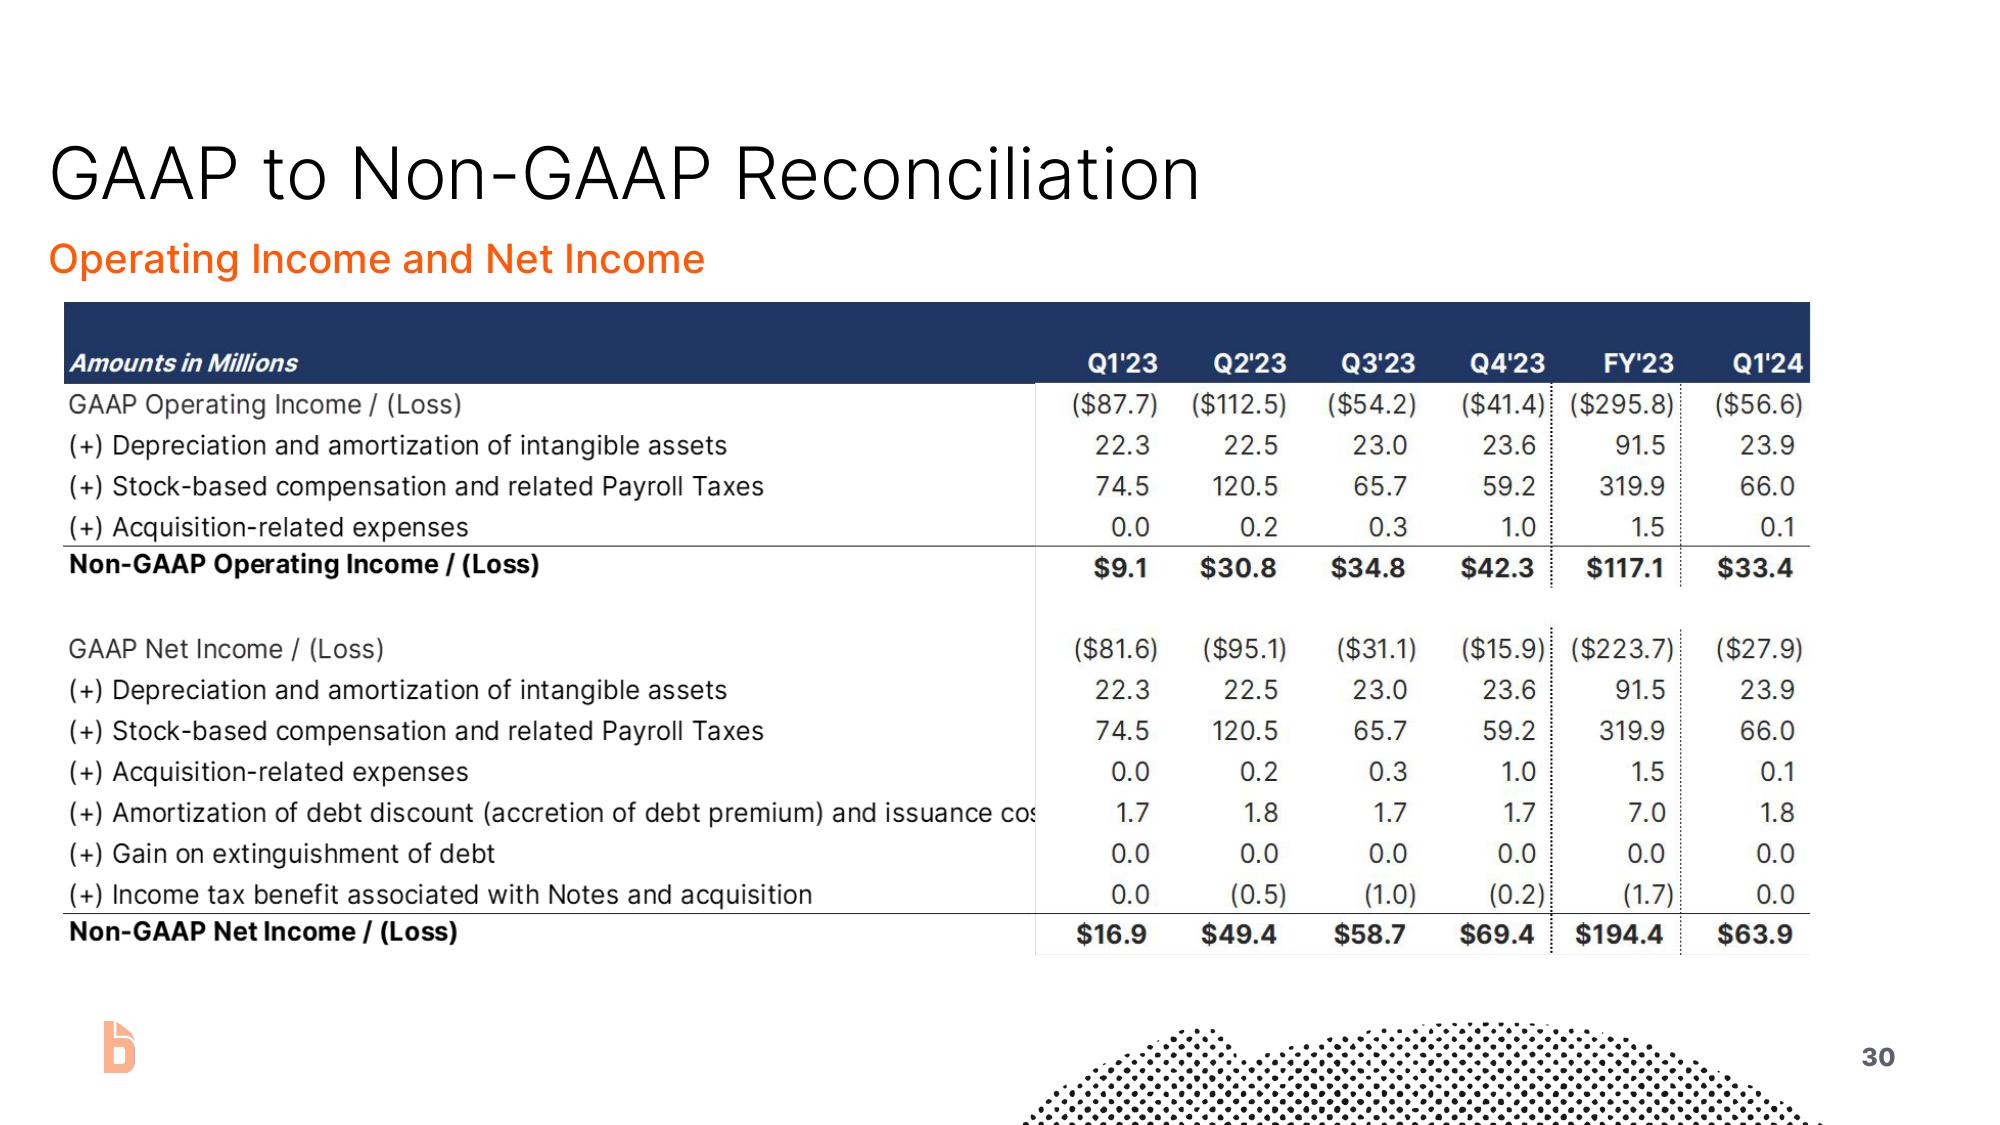
GAAP to Non-GAAP Reconciliation
Operating Income and Net Income
Amounts in Millions
GAAP Operating Income / (Loss)
(+) Depreciation and amortization of intangible assets
(+) Stock-based compensation and related Payroll Taxes
(+) Acquisition-related expenses
Non-GAAP Operating Income / (Loss)
GAAP Net Income / (Loss)
(+) Depreciation and amortization of intangible assets
(+) Stock-based compensation and related Payroll Taxes
(+) Acquisition-related expenses
(+) Amortization of debt discount (accretion of debt premium) and issuance cos
(+) Gain on extinguishment of debt
(+) Income tax benefit associated with Notes and acquisition
Non-GAAP Net Income / (Loss)
Q2'23
Q1'23
($87.7) ($112.5)
22.3
Q3'23 Q4'23 FY¹23
($54.2) ($41.4) ($295.8)
23.6
22.5
23.0
91.5
319.9
120.5
65.7
59.2
74.5
0.0
0.3
1.5
0.2
$30.8 $34.8
1.0
$42.3 $117.1
$9.1
($81.6)
22.3
74.5
0.0
1.7
0.0
0.0
$16.9
($95.1)
($31.1)
($15.9) ($223.7)
22.5
23.0
23.6
91.5
120.5
65.7
59.2
319.9
0.2
0.3
1.0
1.5
1.8
1.7
1.7
7.0
0.0
0.0
0.0
0.0
(0.5)
(1.0)
(0.2)
(1.7)
$49.4 $58.7 $69.4 $194.4
Q1'24
($56.6)
23.9
66.0
0.1
$33.4
($27.9)
23.9
66.0
0.1
1.8
0.0
0.0
$63.9
30View entire presentation