Cloudera Investor Presentation Deck
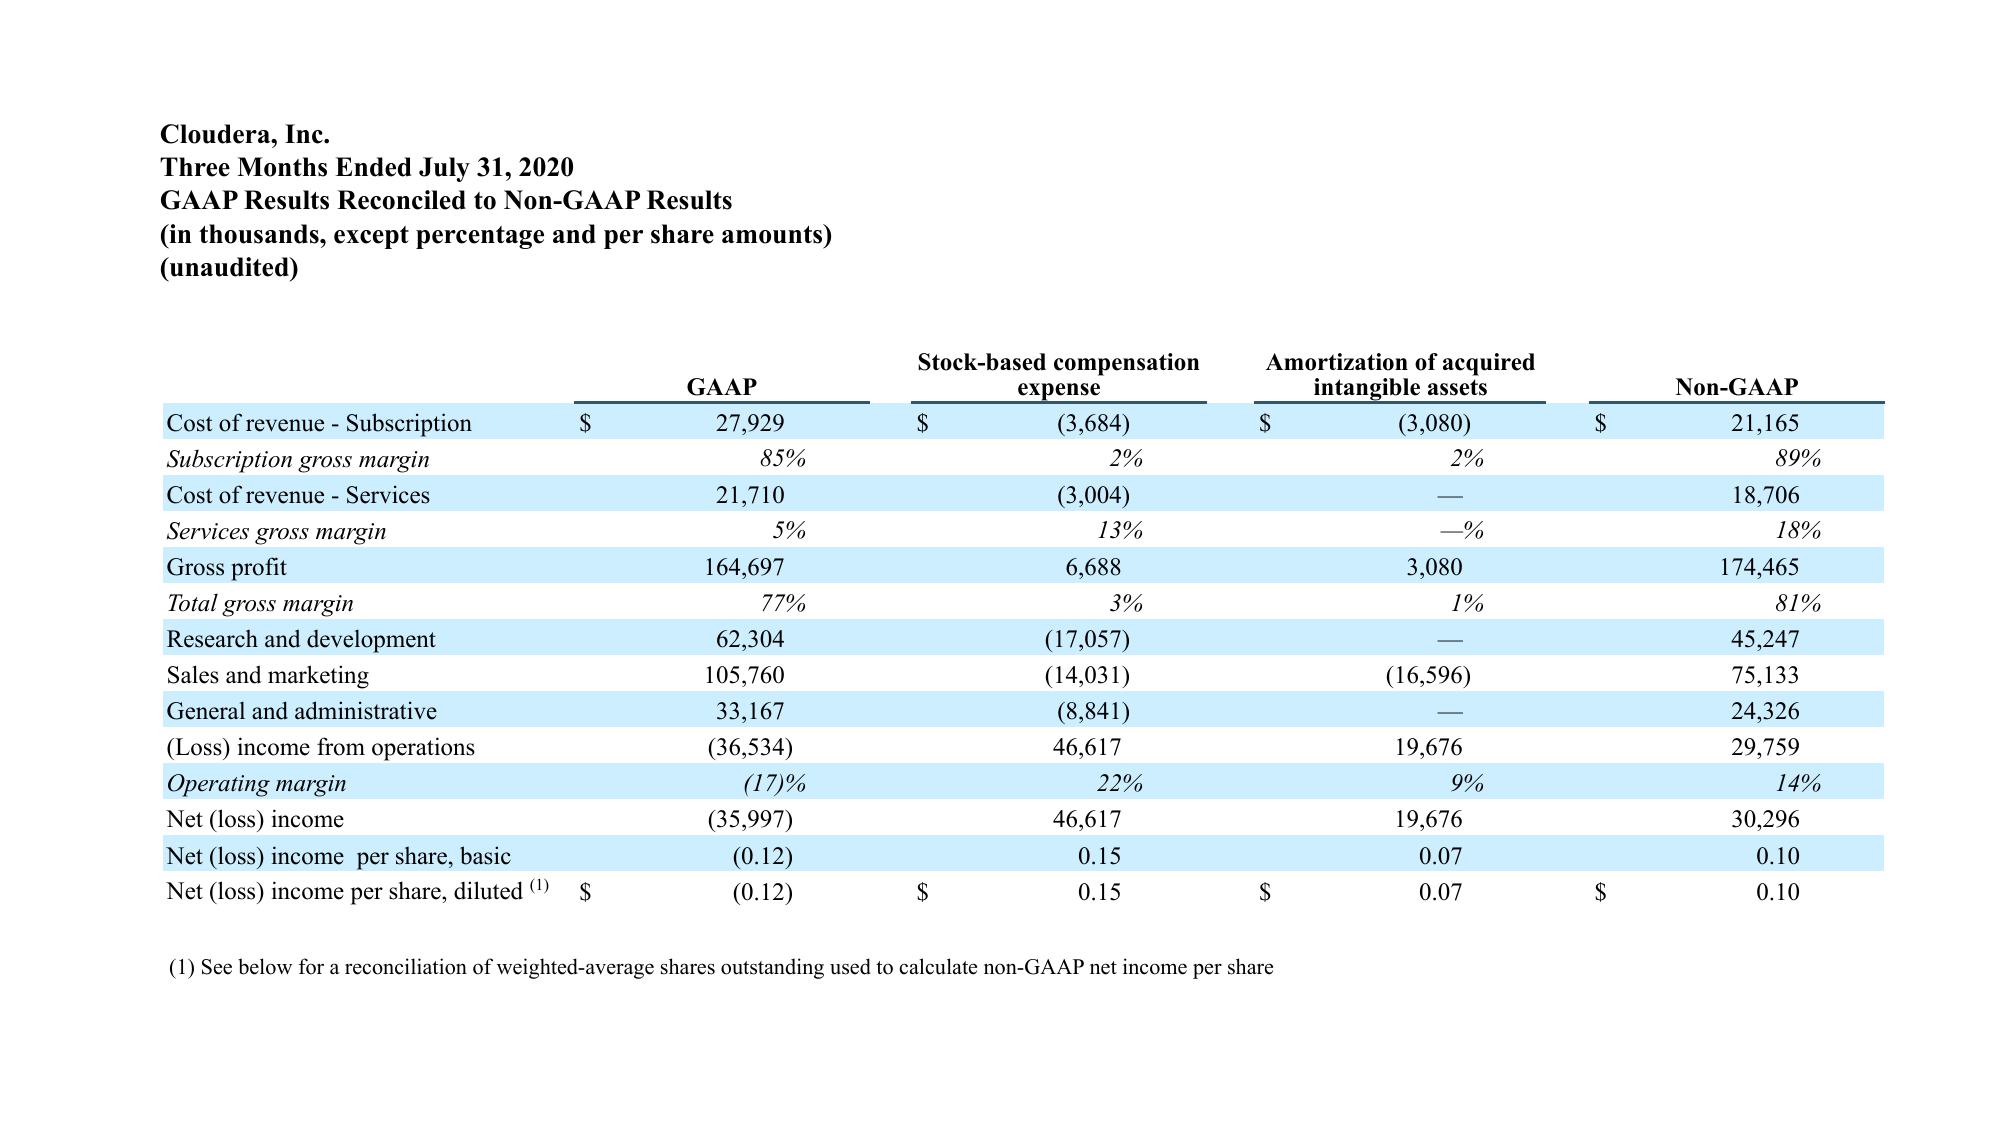
Cloudera, Inc.
Three Months Ended July 31, 2020
GAAP Results Reconciled to Non-GAAP Results
(in thousands, except percentage and per share amounts)
(unaudited)
Cost of revenue - Subscription
Subscription gross margin
Cost of revenue - Services
Services gross margin
Gross profit
Total gross margin
Research and development
Sales and marketing
General and administrative
(Loss) income from operations
Operating margin
Net (loss) income
$
Net (loss) income per share, basic
Net (loss) income per share, diluted (1) $
GAAP
27,929
85%
21,710
5%
164,697
77%
62,304
105,760
33,167
(36,534)
(17)%
(35,997)
(0.12)
(0.12)
Stock-based compensation
$
$
expense
(3,684)
2%
(3,004)
13%
6,688
3%
(17,057)
(14,031)
(8,841)
46,617
22%
46,617
0.15
0.15
Amortization of acquired
intangible assets
(3,080)
$
$
(1) See below for a reconciliation of weighted-average shares outstanding used to calculate non-GAAP net income per share
2%
-%
3,080
1%
(16,596)
19,676
9%
19,676
0.07
0.07
$
$
Non-GAAP
21,165
89%
18,706
18%
174,465
81%
45,247
75,133
24,326
29,759
14%
30,296
0.10
0.10View entire presentation