UBS Fixed Income Presentation Deck
Liquidity
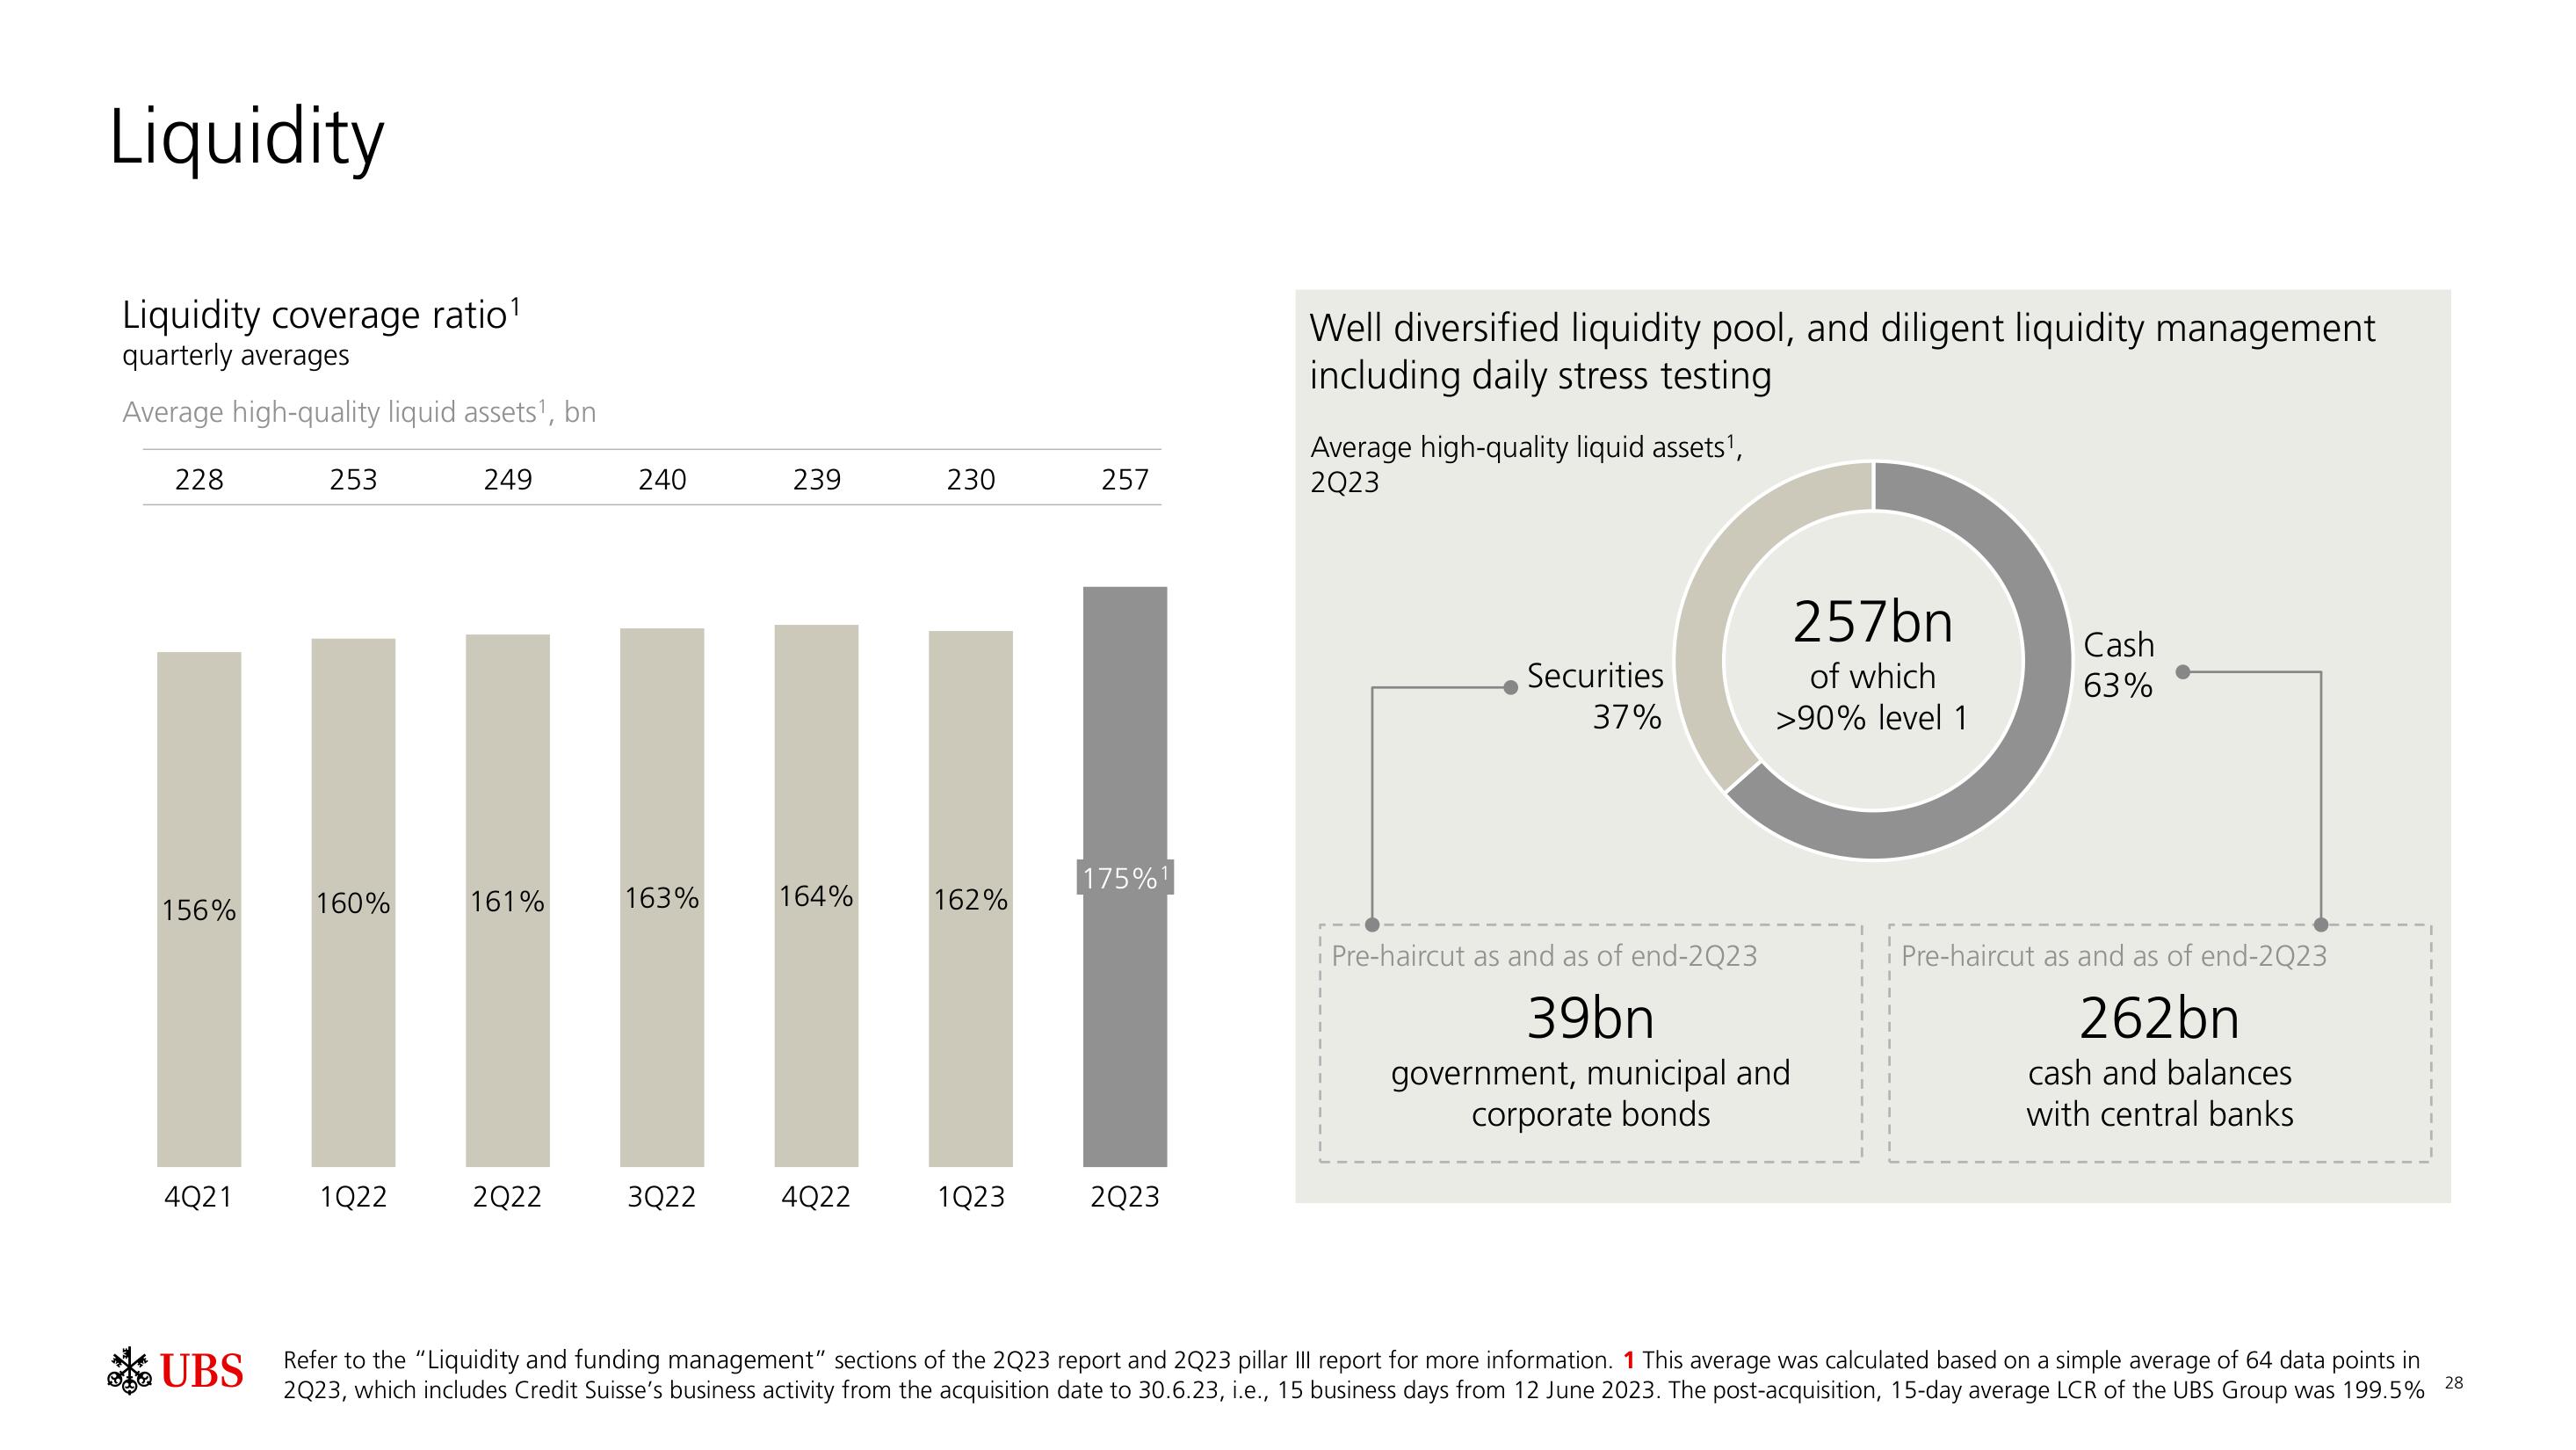
Liquidity coverage ratio¹
quarterly averages
Average high-quality liquid assets¹, bn
228
156%
4Q21
UBS
253
11
161%
160%
249
1Q22
2Q22
240
163%
3Q22
239
164%
4Q22
230
162%
1Q23
257
175%1
2Q23
Well diversified liquidity pool, and diligent liquidity management
including daily stress testing
Average high-quality liquid assets¹,
2Q23
Securities
37%
Pre-haircut as and as of end-2Q23
39bn
257bn
of which
>90% level 1
government, municipal and
corporate bonds
Cash
63%
Pre-haircut as and as of end-2Q23
262bn
cash and balances
with central banks
Refer to the "Liquidity and funding management" sections of the 2Q23 report and 2Q23 pillar III report for more information. 1 This average was calculated based on a simple average of 64 data points in
2Q23, which includes Credit Suisse's business activity from the acquisition date to 30.6.23, i.e., 15 business days from 12 June 2023. The post-acquisition, 15-day average LCR of the UBS Group was 199.5%
I
1
28View entire presentation