3Q20 Earnings Call Presentation
Retail Portfolio in Asia
($ per Sq. Foot, Unless Otherwise Indicated)
3Q20
2
Sales per Sq. Ft.²
GLA¹
(Sq. Ft)
Occupancy %
at Period End
TTM 3Q20
TTM 2Q20
TTM 1Q20
TTM 4Q19
TTM 3Q19
The Shoppes at Marina Bay Sands
620,213
95.0%
$1,225
$1,500
$1,917
$2,062
$2,028
Shoppes at Venetian
812,934
84.9%
$935
$1,224
$1,460
$1,709
$1,708
Shoppes at Four Seasons
Luxury Retail
125,466
100.0%
$3,665
$4,756
$6,033
$7,065
$6,652
Other Stores
116,959
88.1%
$1,354
$1,924
$2,481
$2,823
$2,687
Shoppes at Cotai Central
525,497
85.6%
$476
$603
$780
$934
$966
Shoppes at Parisian
295,963
82.5%
$407
$561
$687
$785
$688
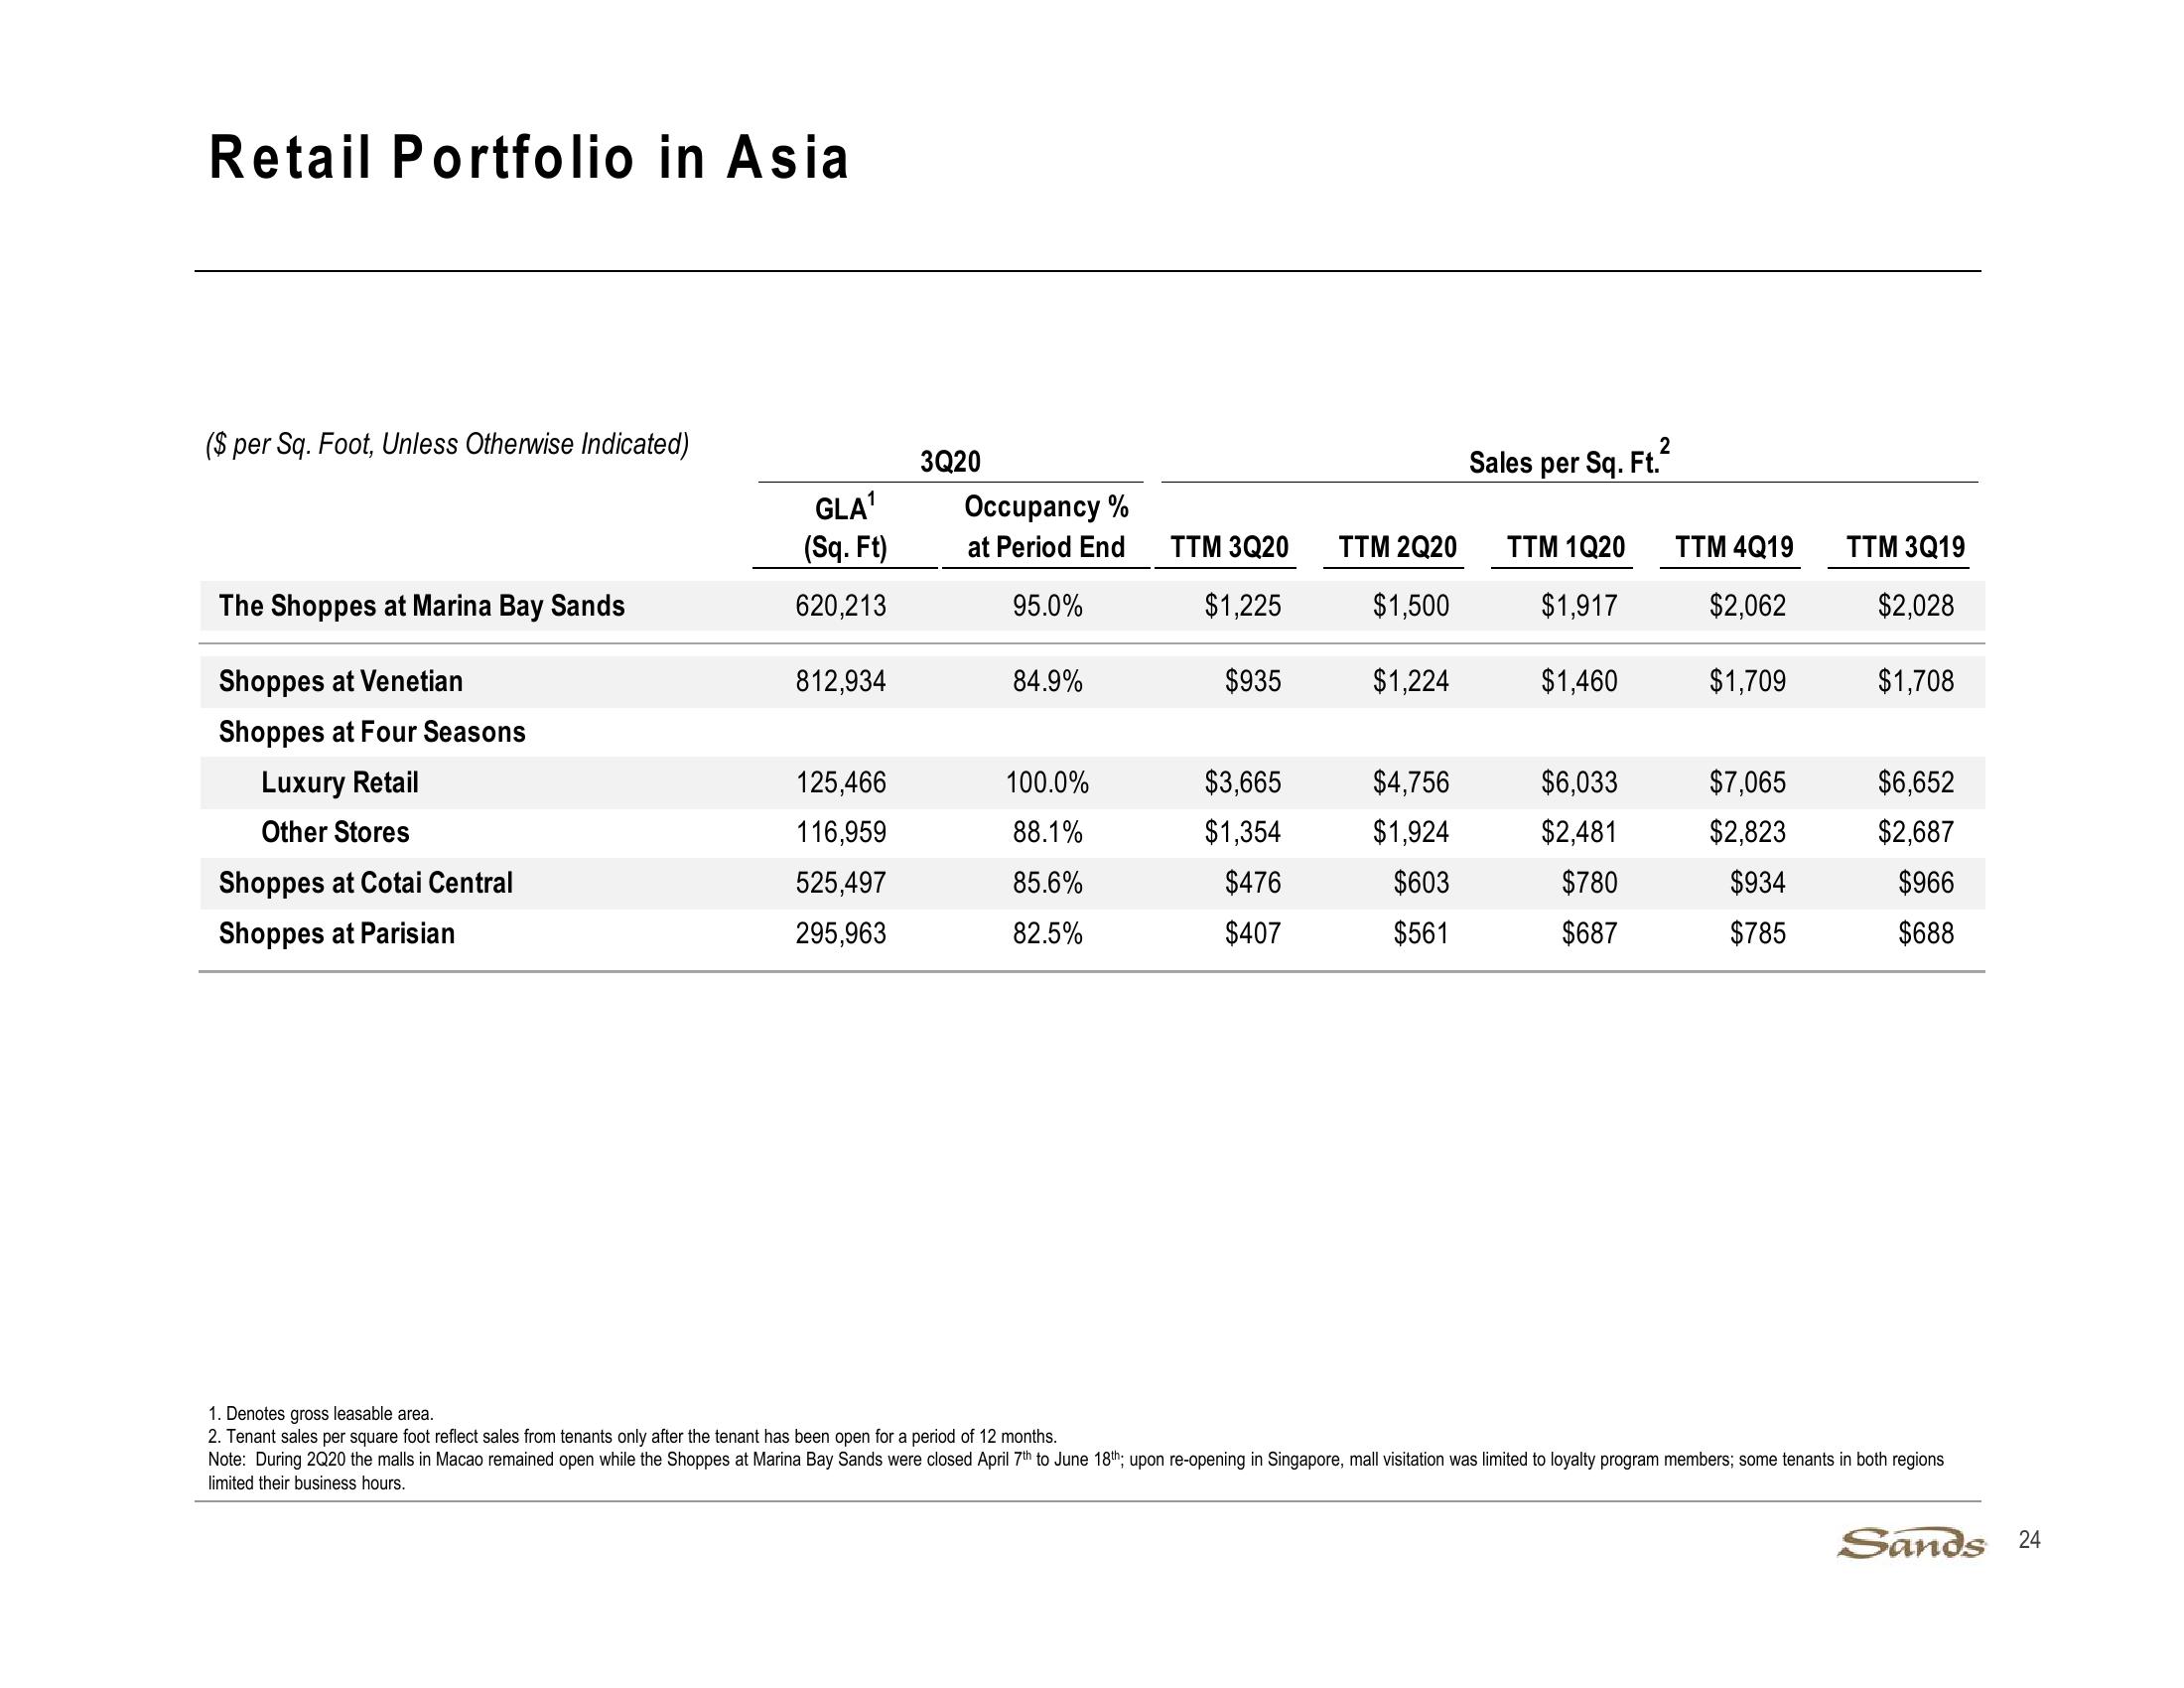
1. Denotes gross leasable area.
2. Tenant sales per square foot reflect sales from tenants only after the tenant has been open for a period of 12 months.
Note: During 2Q20 the malls in Macao remained open while the Shoppes at Marina Bay Sands were closed April 7th to June 18th; upon re-opening in Singapore, mall visitation was limited to loyalty program members; some tenants in both regions
limited their business hours.
Sands 24View entire presentation