Kymera Investor Presentation Deck
% Change from C1D1 Predose
(Mean ± SEM)
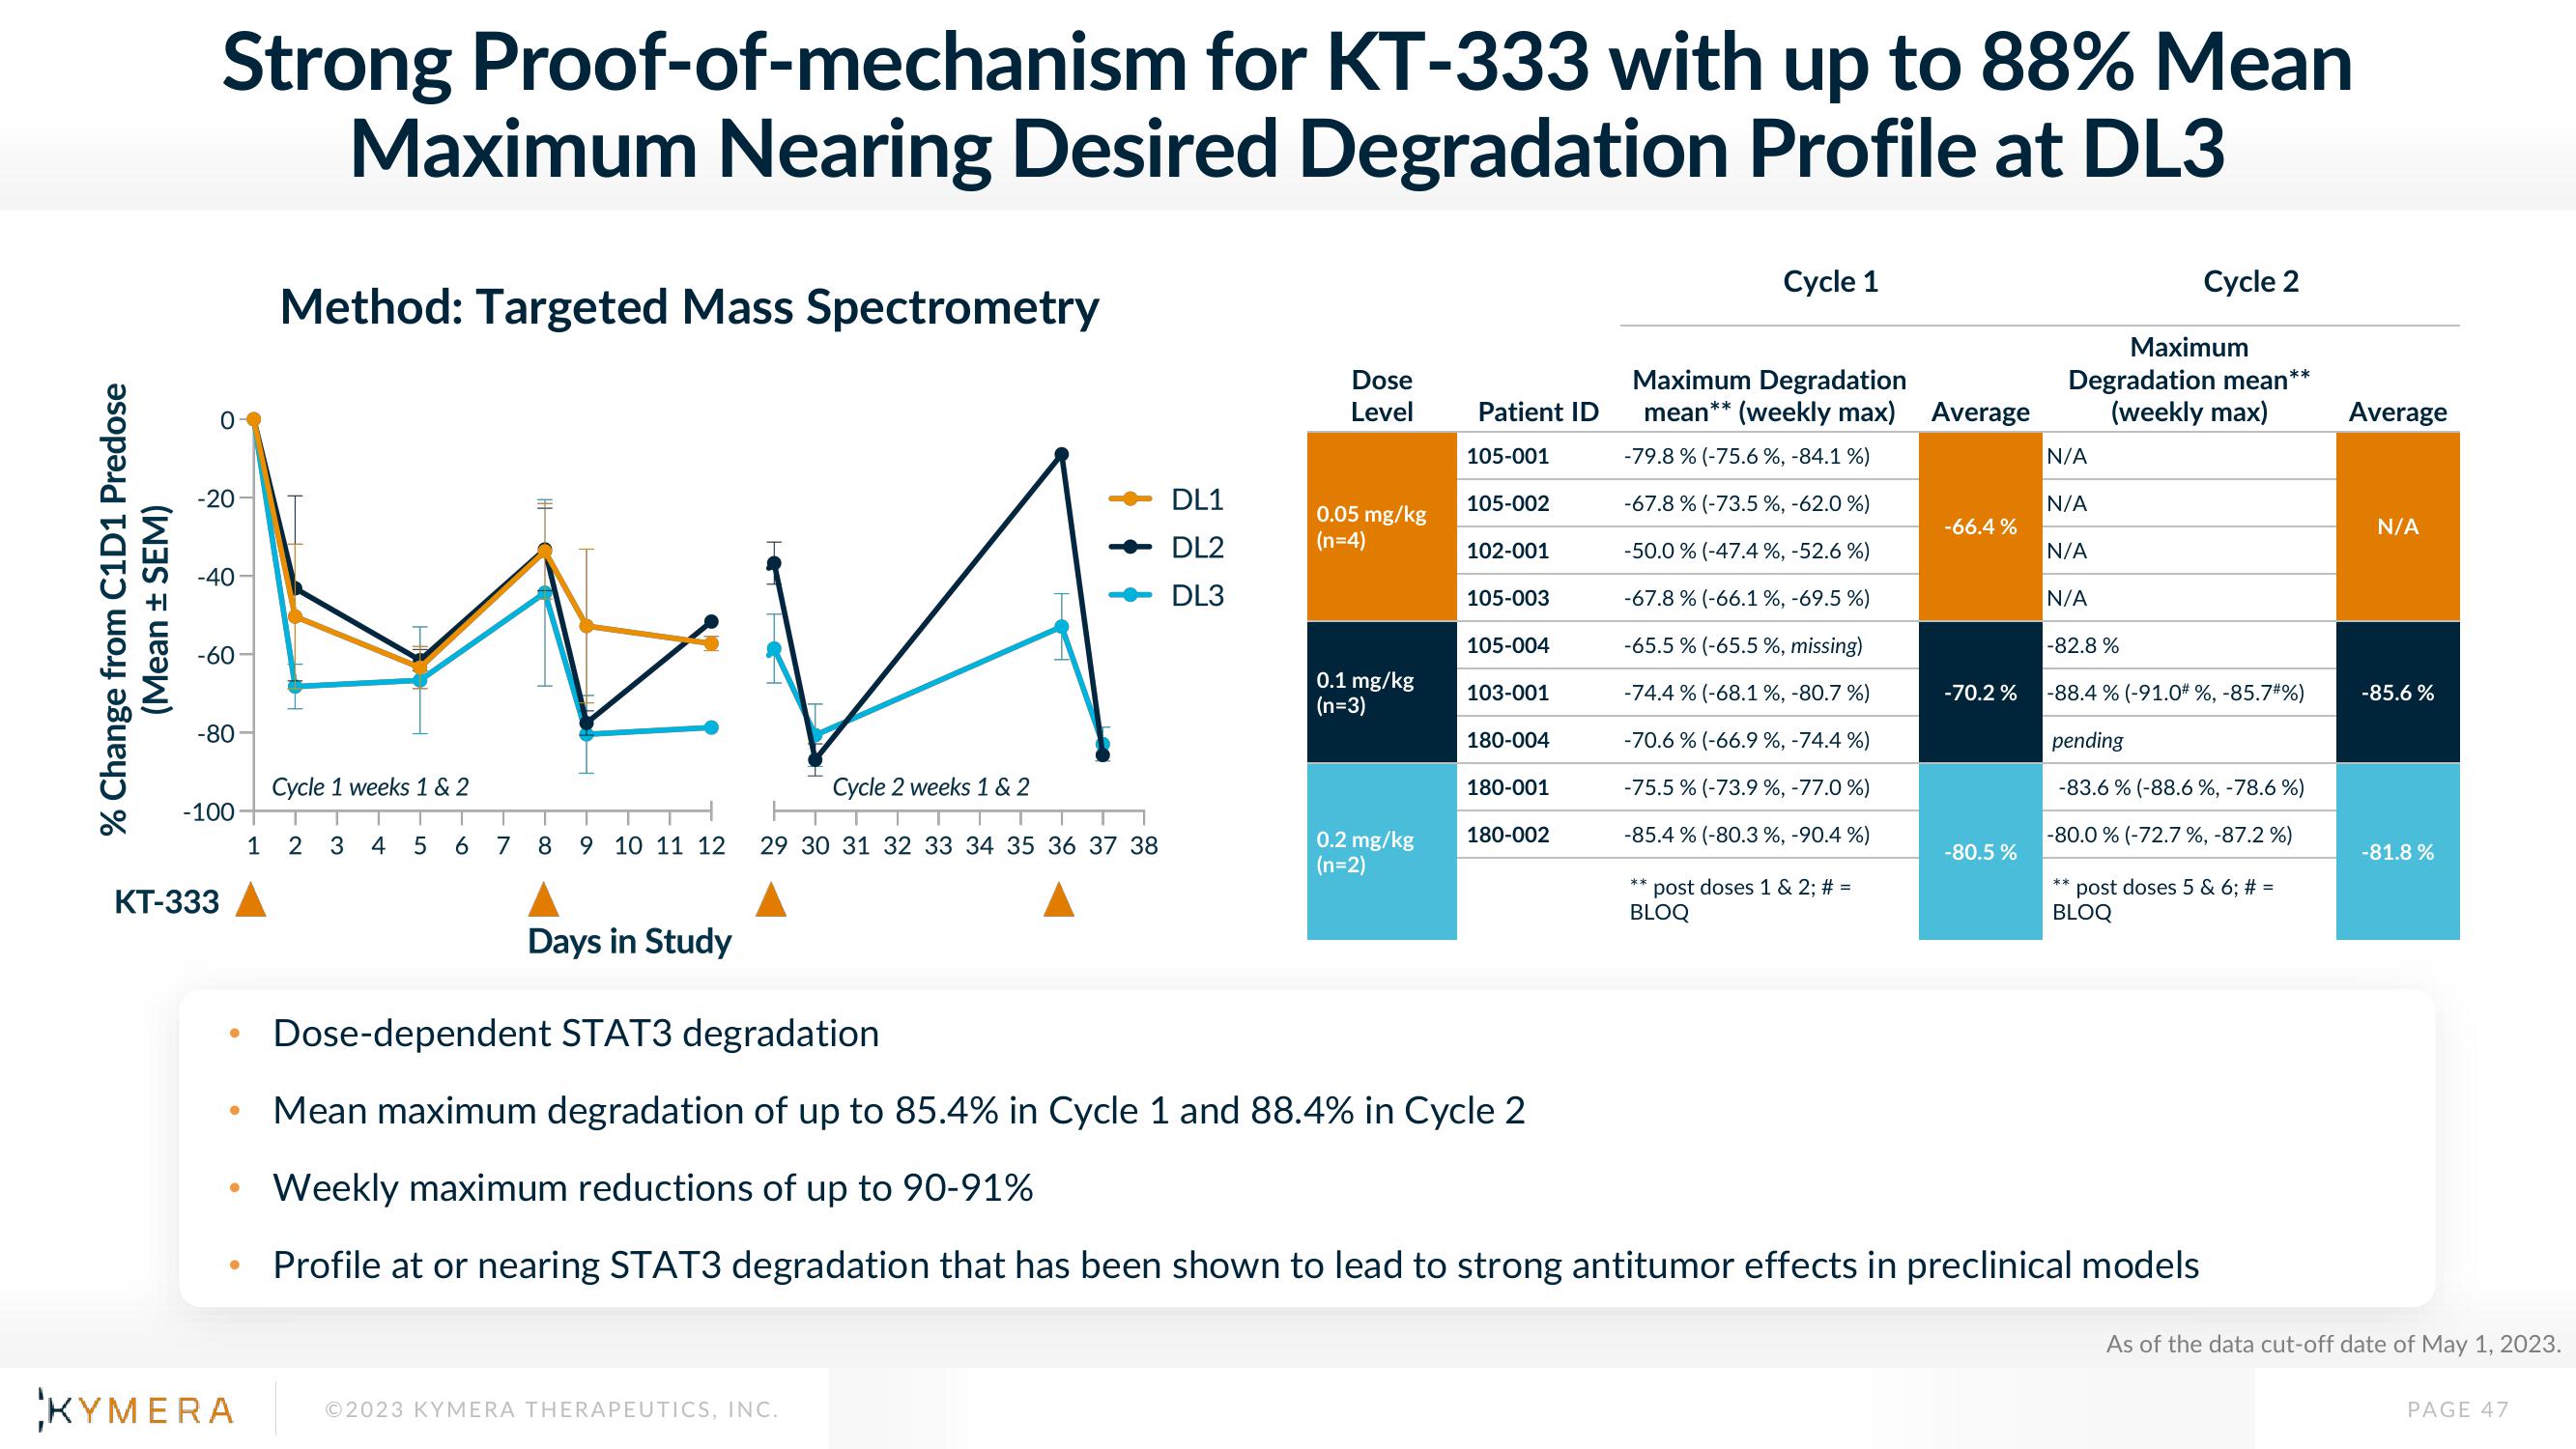
Strong Proof-of-mechanism for KT-333 with up to 88% Mean
Maximum Nearing Desired Degradation Profile at DL3
-20
WA
Cycle 1 weeks 1 & 2
T T T T T T
9 10 11 12 29 30 31 32 33 34 35 36 37 38
-40
-60
-80-
-100
KT-333
●
●
Method: Targeted Mass Spectrometry
KYMERA
T T
1 2 3
T
4 5 6 7 8
Cycle 2 weeks 1 & 2
©2023 KYMERA THERAPEUTICS, INC.
+++
DL1
DL2
DL3
Dose
Level
0.05 mg/kg
(n=4)
0.1 mg/kg
(n=3)
0.2 mg/kg
(n=2)
Patient ID
105-001
105-002
102-001
105-003
105-004
103-001
180-004
180-001
180-002
Cycle 1
Maximum Degradation
mean** (weekly max)
-79.8% (-75.6 %, -84.1 %)
-67.8 % (-73.5%, -62.0 %)
-50.0 % (-47.4 %, -52.6 %)
-67.8% (-66.1 %, -69.5 %)
-65.5 % (-65.5 %, missing)
-74.4 % (-68.1 %, -80.7%)
-70.6 % (-66.9 %, -74.4 %)
-75.5% (-73.9 %, -77.0%)
-85.4 % (-80.3 %, -90.4 %)
** post doses 1 & 2; # =
BLOQ
Average
-66.4%
-70.2%
-80.5%
Maximum
Degradation mean
(weekly max)
N/A
N/A
N/A
Cycle 2
Days in Study
Dose-dependent STAT3 degradation
Mean maximum degradation of up to 85.4% in Cycle 1 and 88.4% in Cycle 2
Weekly maximum reductions of up to 90-91%
Profile at or nearing STAT3 degradation that has been shown to lead to strong antitumor effects in preclinical models
N/A
-82.8 %
-88.4 % (-91.0# %, -85.7#%)
pending
-83.6% (-88.6 %, -78.6%)
-80.0 % (-72.7%, -87.2%)
** post doses 5 & 6; # =
BLOQ
**
Average
N/A
-85.6 %
-81.8%
As of the data cut-off date of May 1, 2023.
PAGE 47View entire presentation