LVMH Results Presentation Deck
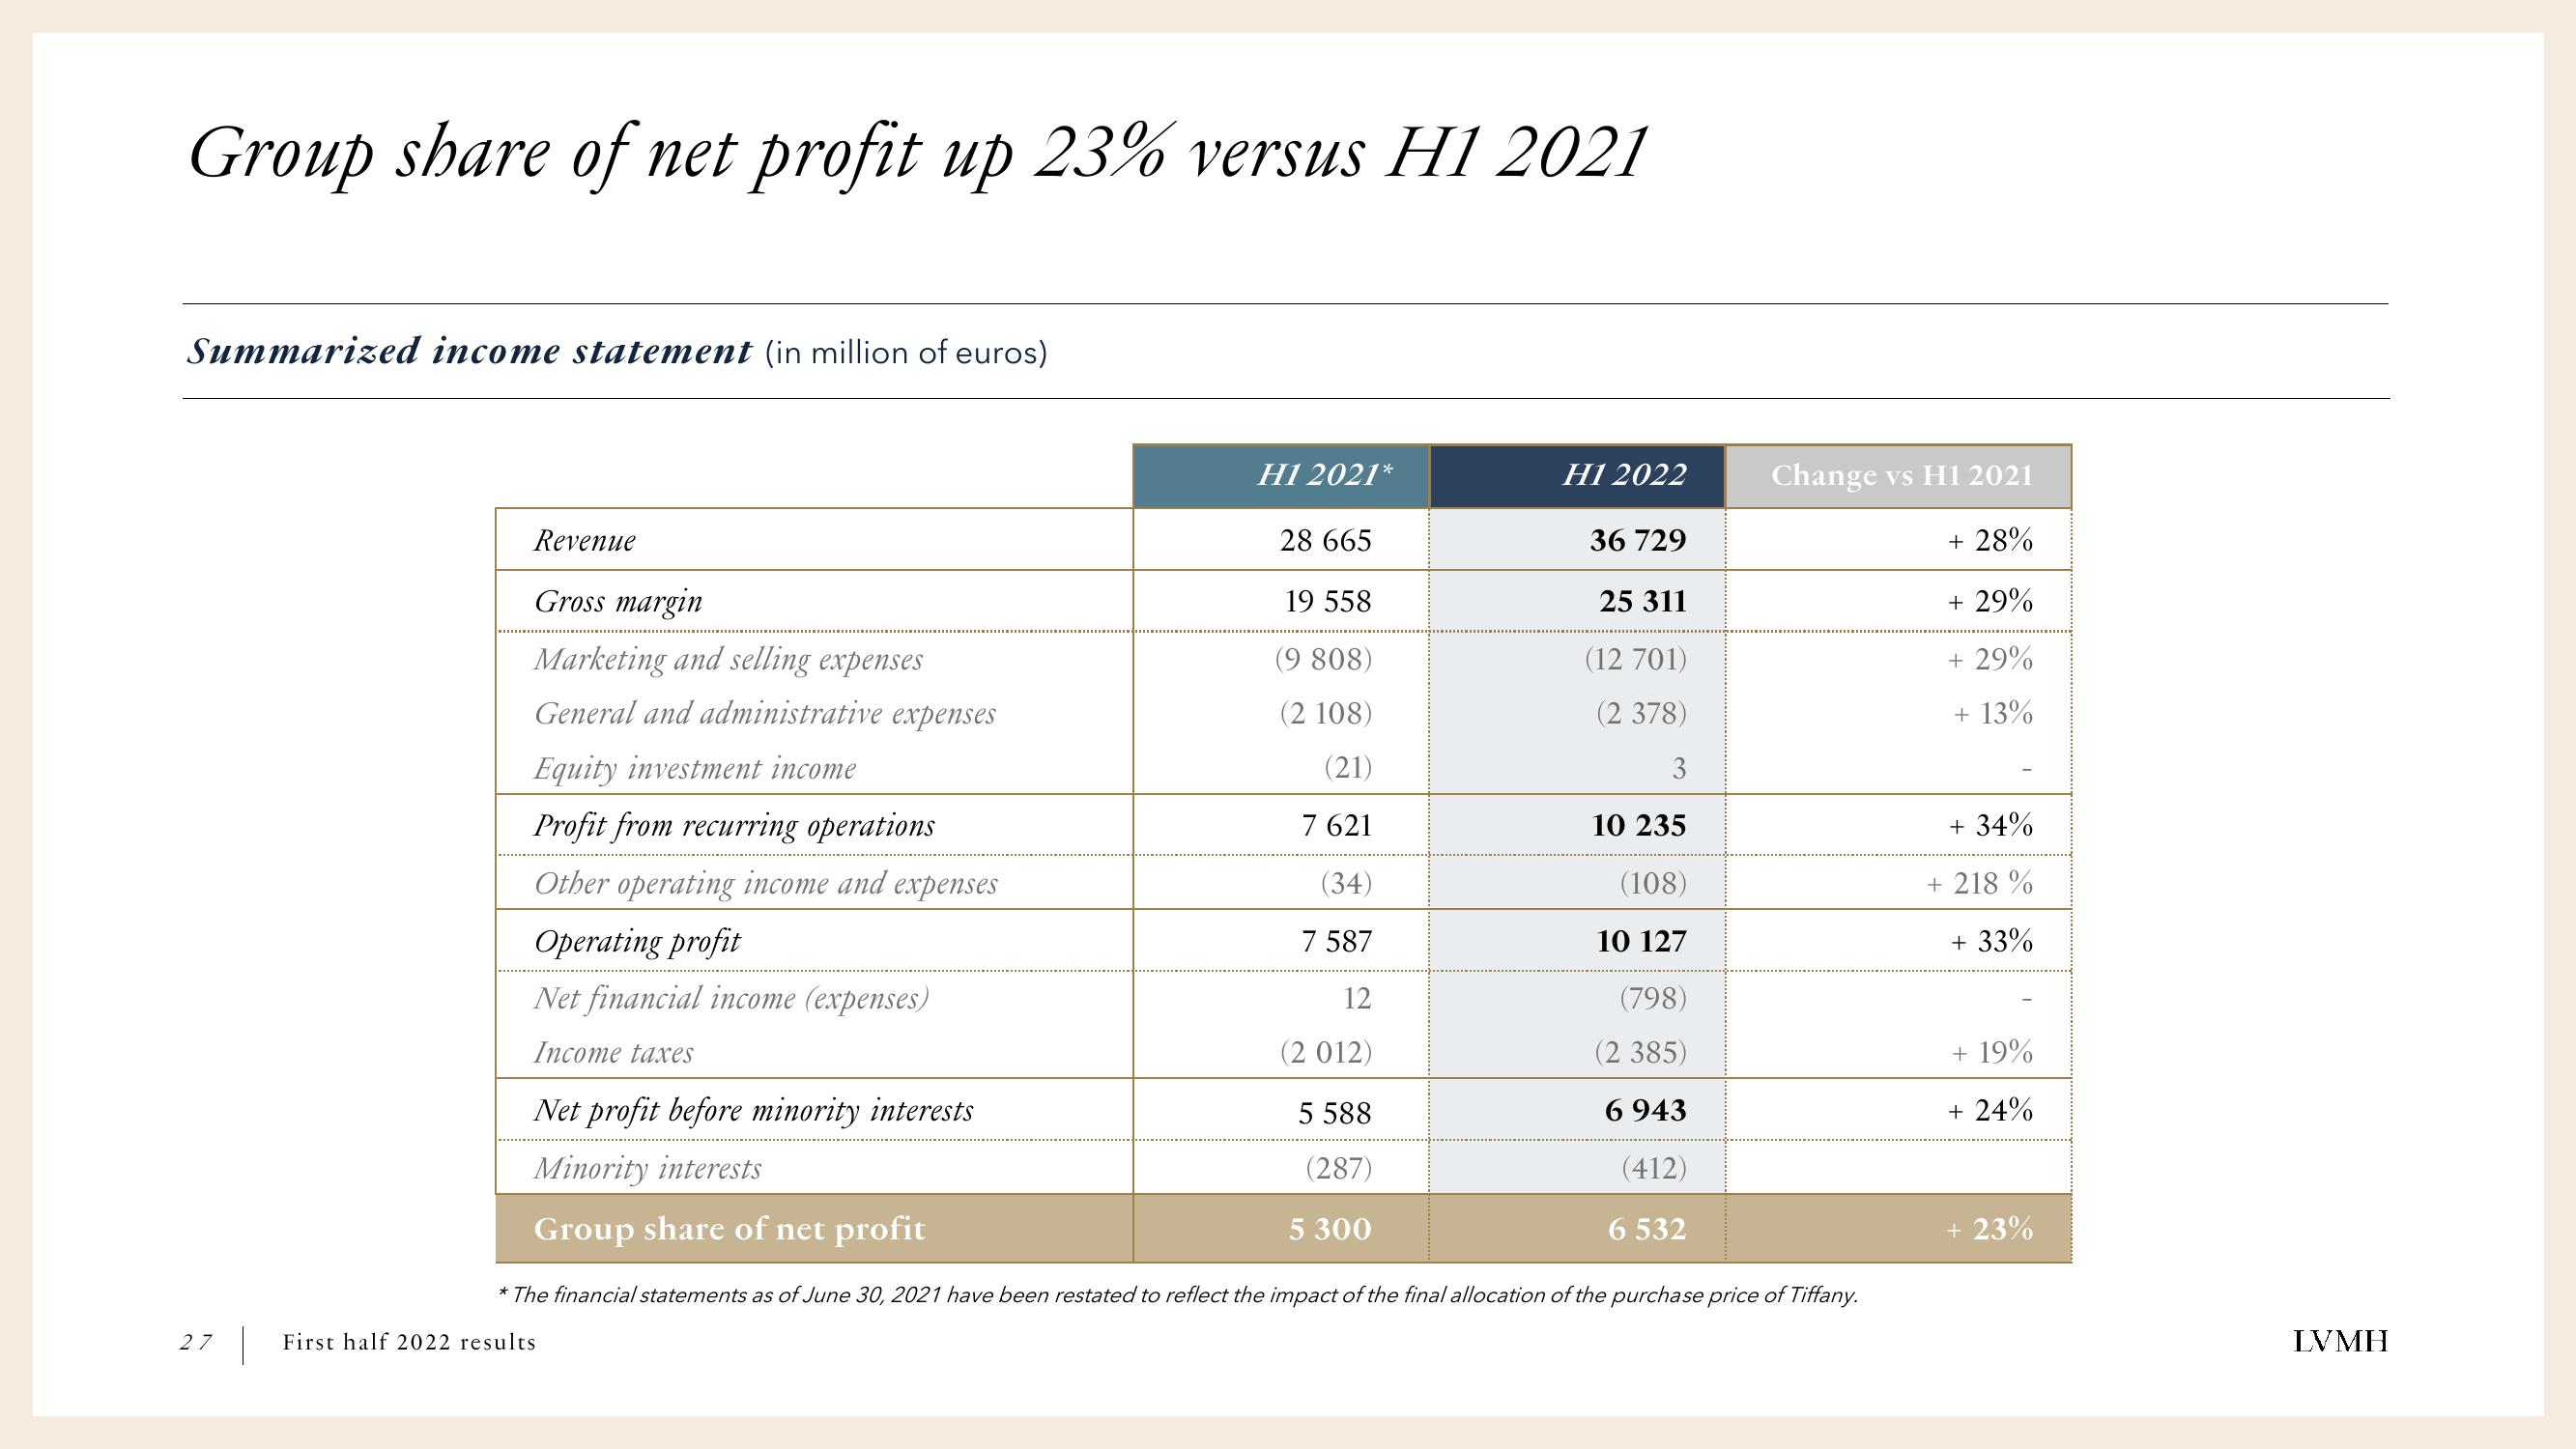
Group share of net profit up 23% versus H1 2021
Summarized income statement (in million of euros)
Revenue
Gross margin
Marketing and selling expenses
General and administrative expenses
Equity investment income
Profit from recurring operations
Other operating income and expenses
Operating profit
Net financial income (expenses)
Income taxes
Net profit before minority interests
Minority interests
Group share of net profit
H1 2021*
27 First half 2022 results
28 665
19 558
(9 808)
(2 108)
(21)
7 621
(34)
7 587
12
(2 012)
5 588
(287)
5 300
H1 2022
36 729
25 311
(12 701)
(2 378)
3
10 235
(108)
10 127
(798)
(2 385)
6943
(412)
6 532
Change vs H1 2021
+ 28%
+ 29%
+ 29%
+ 13%
* The financial statements as of June 30, 2021 have been restated to reflect the impact of the final allocation of the purchase price of Tiffany.
+ 34%
+ 218 %
+ 33%
+19%
+ 24%
+ 23%
LVMHView entire presentation