Avantor Results Presentation Deck
Q4 and FY adjusted P&L
USD in millions
Reported Revenue
Core organic growth
Adj. Gross Profit
Adj. Gross Profit %
Adj. EBITDA
Adj. EBITDA %
Adj. Earnings Per Share
Free Cash Flow
Adj. Net Leverage
Navantor™
Q4 2022
$1,795.0
2.7%
$615.1
34.3%
$359.5
20.0%
$0.32
$172.0
3.7X4
FY 2022
$7,512.4
6.0%
$2,617.2
34.8%
$1,570.7
20.9%
$1.41
$710.2
3.7X4
COMMENTS
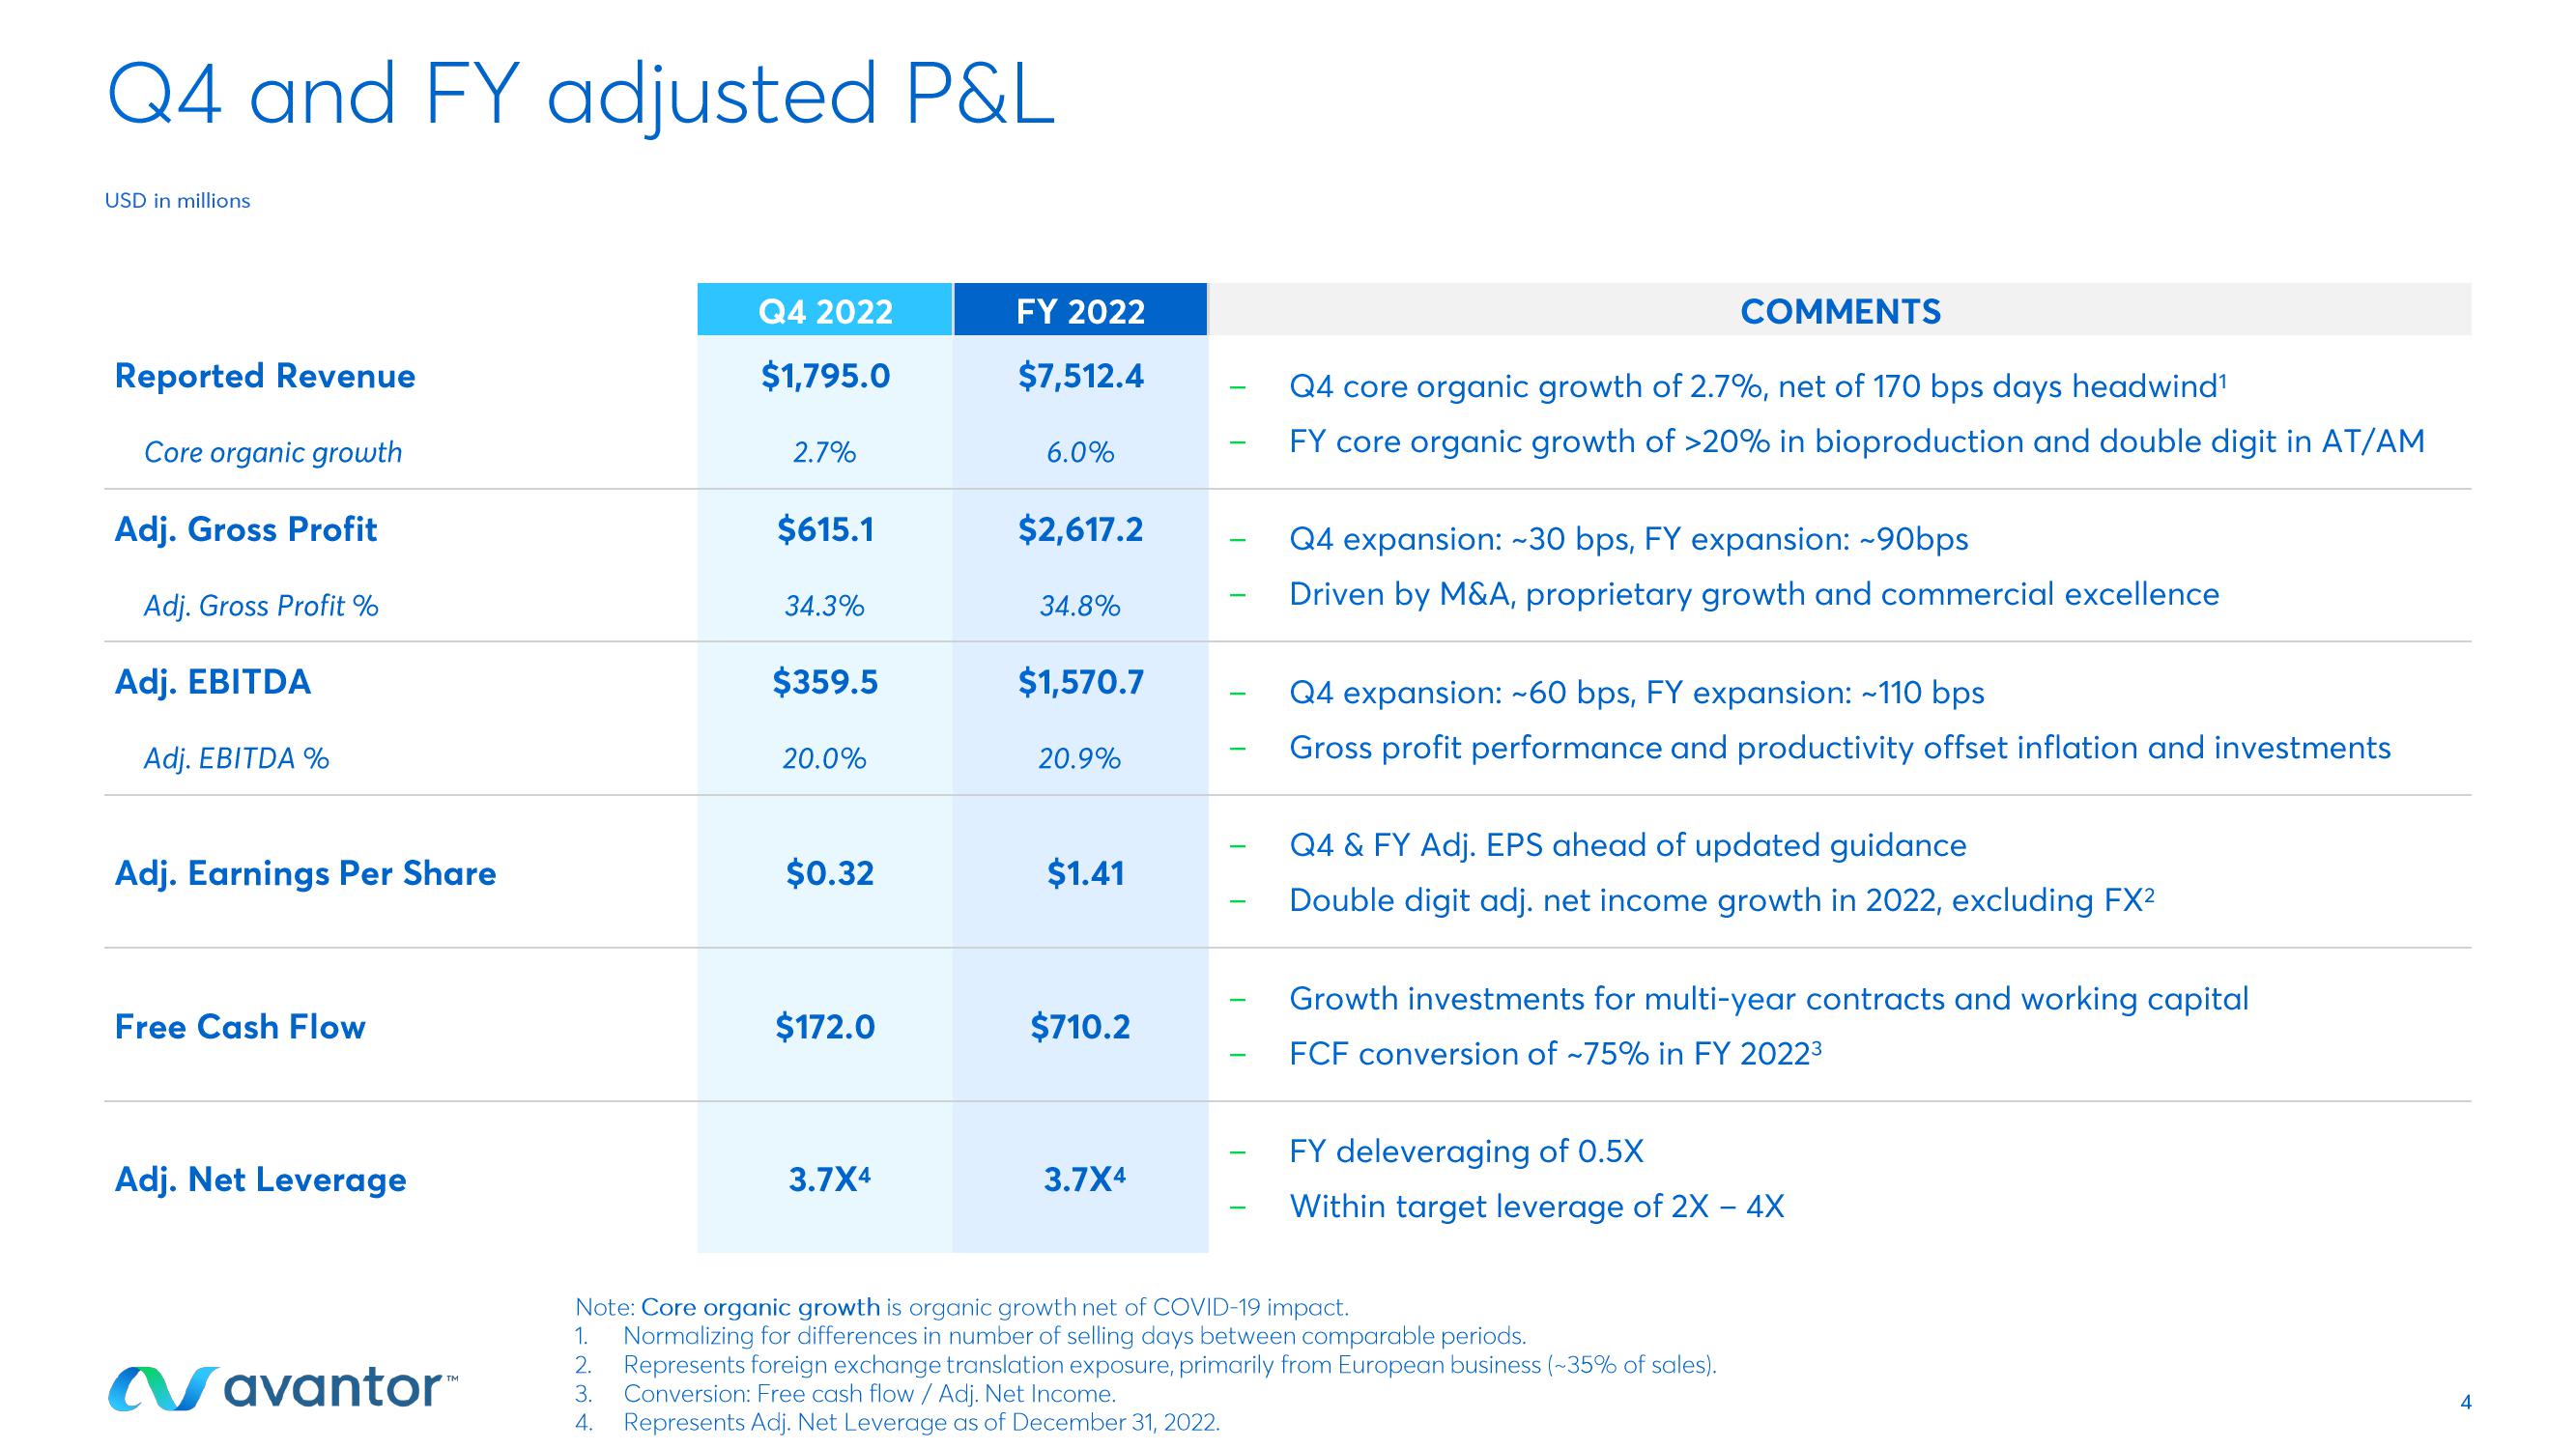
Q4 core organic growth of 2.7%, net of 170 bps days headwind¹
FY core organic growth of >20% in bioproduction and double digit in AT/AM
1.
2.
3. Conversion: Free cash flow / Adj. Net Income.
4. Represents Adj. Net Leverage as of December 31, 2022.
Q4 expansion: ~30 bps, FY expansion: ~90bps
Driven by M&A, proprietary growth and commercial excellence
Q4 expansion: ~60 bps, FY expansion: ~110 bps
Gross profit performance and productivity offset inflation and investments
Q4 & FY Adj. EPS ahead of updated guidance
Double digit adj. net income growth in 2022, excluding FX²
Growth investments for multi-year contracts and working capital
FCF conversion of -75% in FY 2022³
FY deleveraging of 0.5X
Within target leverage of 2X - 4X
Note: Core organic growth is organic growth net of COVID-19 impact.
Normalizing for differences in number of selling days between comparable periods.
Represents foreign exchange translation exposure, primarily from European business (~35% of sales).
4View entire presentation