Hanmi Financial Results Presentation Deck
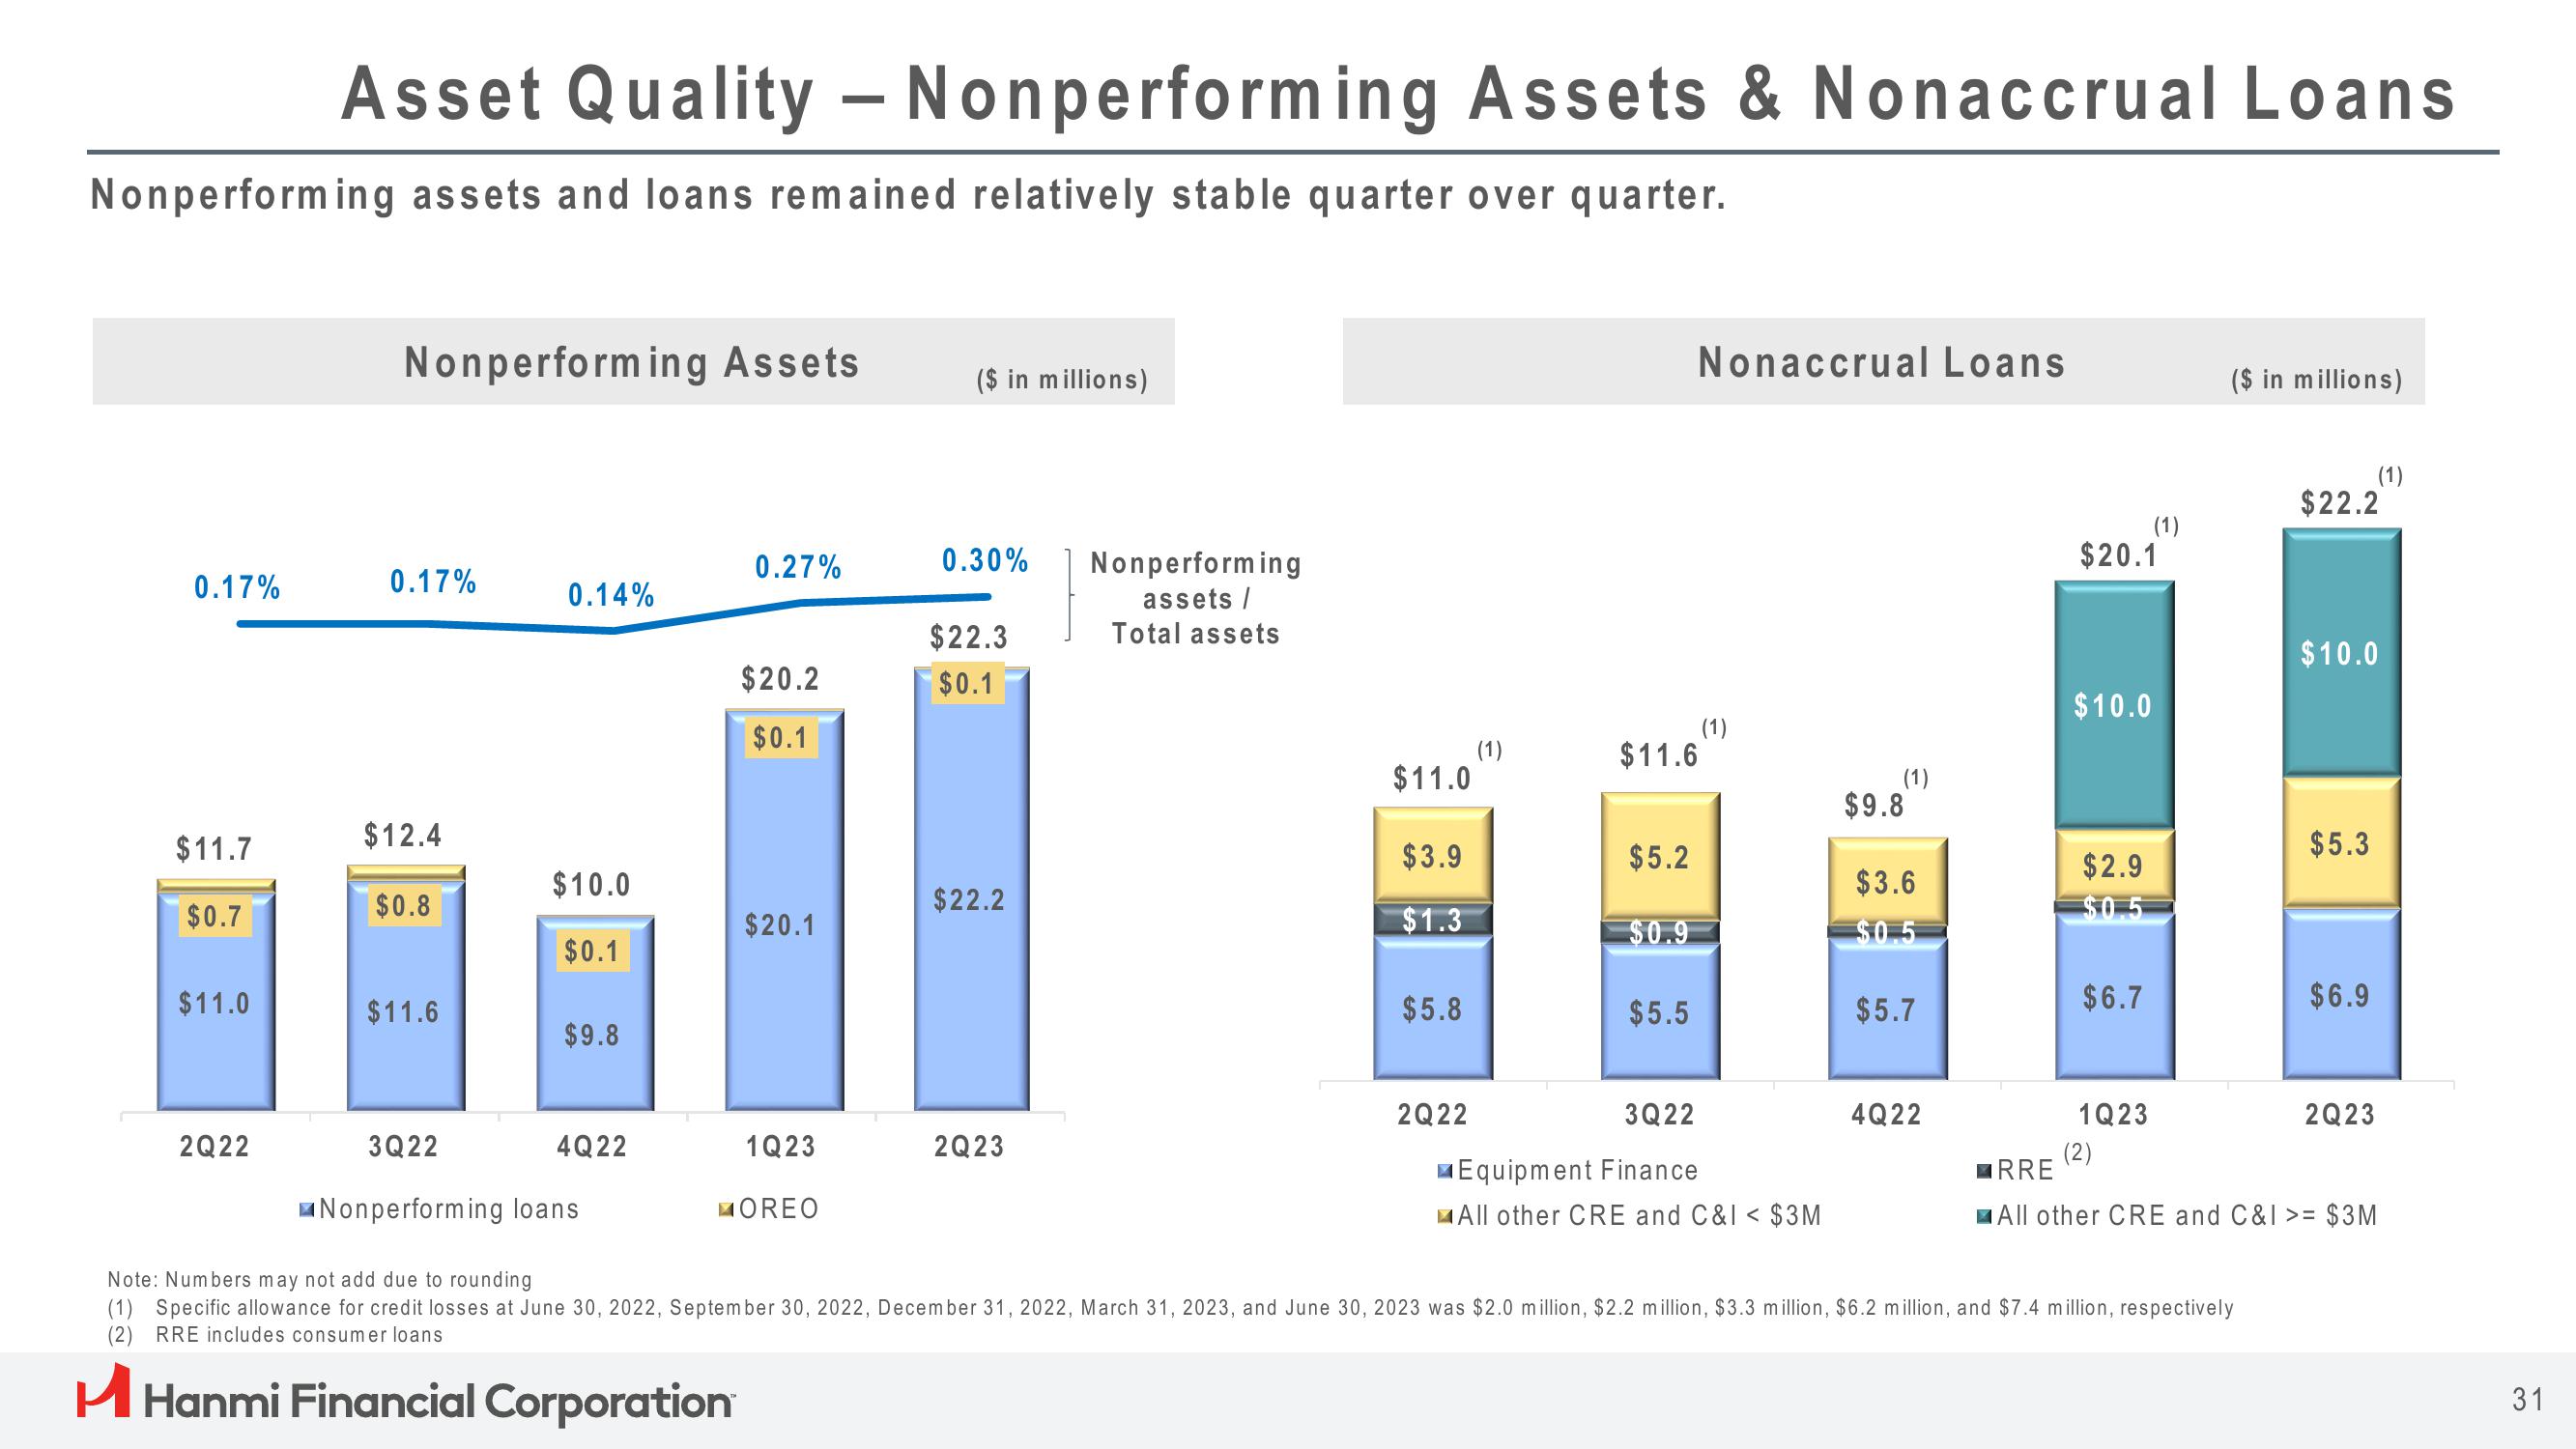
Nonperforming assets and loans remained relatively stable quarter over quarter.
0.17%
$11.7
$0.7
$11.0
Asset Quality - Nonperforming Assets & Nonaccrual Loans
2Q22
Nonperforming Assets
0.17%
$12.4
$0.8
$11.6
0.14%
$10.0
$0.1
$9.8
4Q22
3Q22
Nonperforming loans
0.27%
$20.2
$0.1
$20.1
1Q23
MOREO
($ in millions)
0.30% Nonperforming
assets/
Total assets
$22.3
$0.1
$22.2
2Q23
$11.0
$3.9
$1.3
$5.8
2Q22
(1)
$11.6
$5.2
$0.9
$5.5
Nonaccrual Loans
(1)
3Q22
Equipment Finance
All other CRE and C&I < $3M
(1)
$9.8
$3.6
$5.7
4Q22
$20.1
$10.0
$2.9
$6.7
(1)
1Q23
(2)
($ in millions)
(1)
$22.2
Note: Numbers may not add due to rounding
(1) Specific allowance for credit losses at June 30, 2022, September 30, 2022, December 31, 2022, March 31, 2023, and June 30, 2023 was $2.0 million, $2.2 million, $3.3 million, $6.2 million, and $7.4 million, respectively
(2) RRE includes consumer loans
H Hanmi Financial Corporation
$10.0
$5.3
$6.9
2Q23
RRE
All other CRE and C&I >= $3M
31View entire presentation