Marten Transport Results Presentation Deck
PL
Consistently Improving Organic Operating Results
No Matter the Market Environment
Each year since 2018 has had a very different market environment
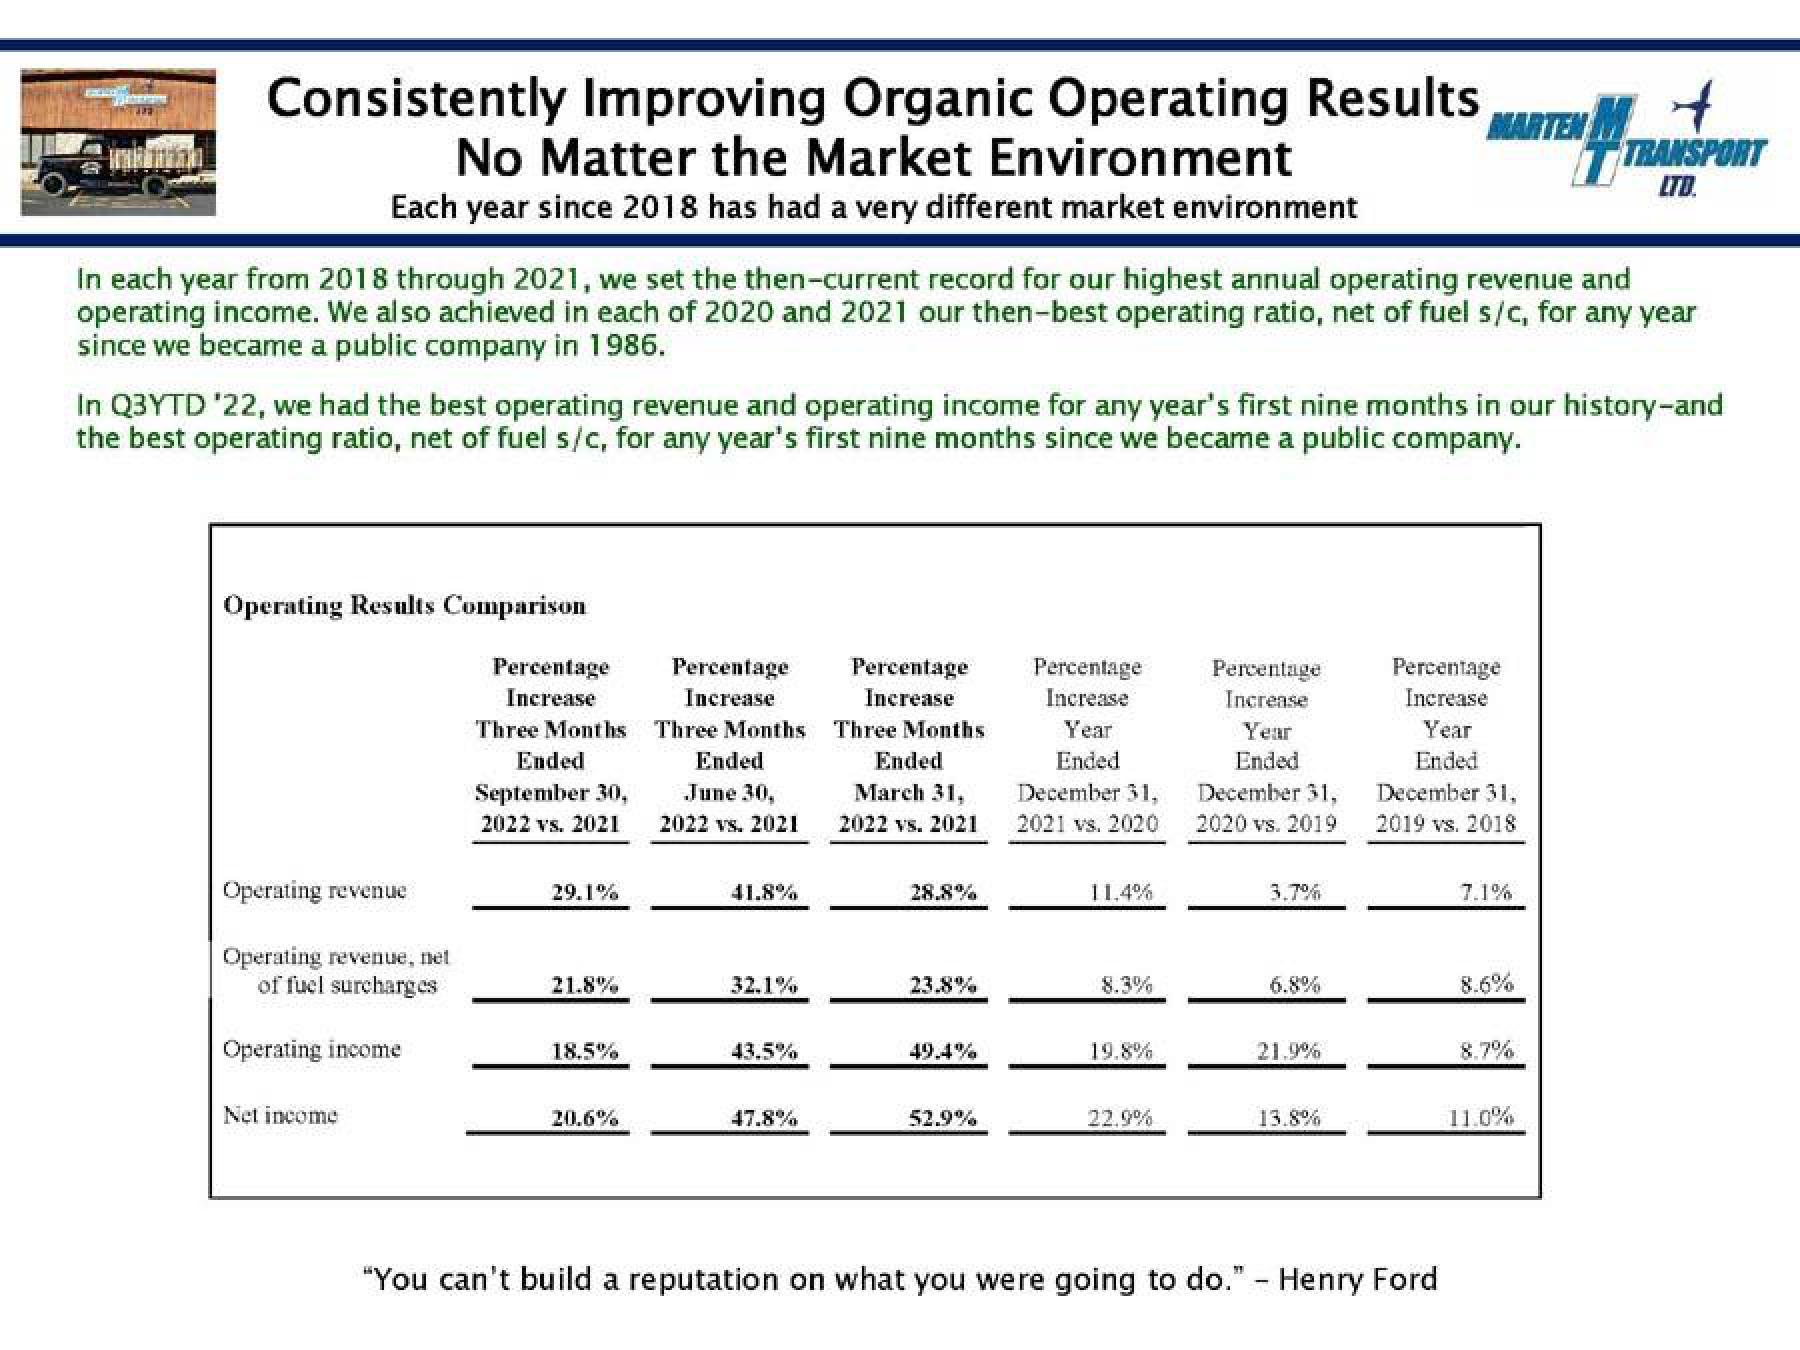
In each year from 2018 through 2021, we set the then-current record for our highest annual operating revenue and
operating income. We also achieved in each of 2020 and 2021 our then-best operating ratio, net of fuel s/c, for any year
since we became a public company in 1986.
Operating Results Comparison
In Q3YTD '22, we had the best operating revenue and operating income for any year's first nine months in our history-and
the best operating ratio, net of fuel s/c, for any year's first nine months since we became a public company.
Operating revenue
Operating revenue, net
of fuel surcharges
Operating income
Net income
Percentage
Increase
Three Months
Ended
September 30,
2022 vs. 2021
29.1%
21.8%
18.5%
20.6%
Percentage
Increase
Three Months
Ended
June 30,
2022 vs. 2021
41.8%
32.1%
43.5%
47.8%
Percentage
Increase
Three Months
Ended
March 31,
2022 vs. 2021
28.8%
23.8%
49.4%
52.9%
Percentage
Increase
Year
Ended
December 31.
2021 vs. 2020
11.4%
8.3%
19.8%
22.9%
Percentage
Increase
Year
Ended
December 31,
2020 vs. 2019
3.7%
6.8%
21.9%
MARTEN M
13.8%
Percentage
Increase
Year
Ended
December 31,
2019 vs. 2018
"You can't build a reputation on what you were going to do." - Henry Ford
7.1%
8.6%
TRANSPORT
LTD.
8.7%
11.0%View entire presentation