Uber Results Presentation Deck
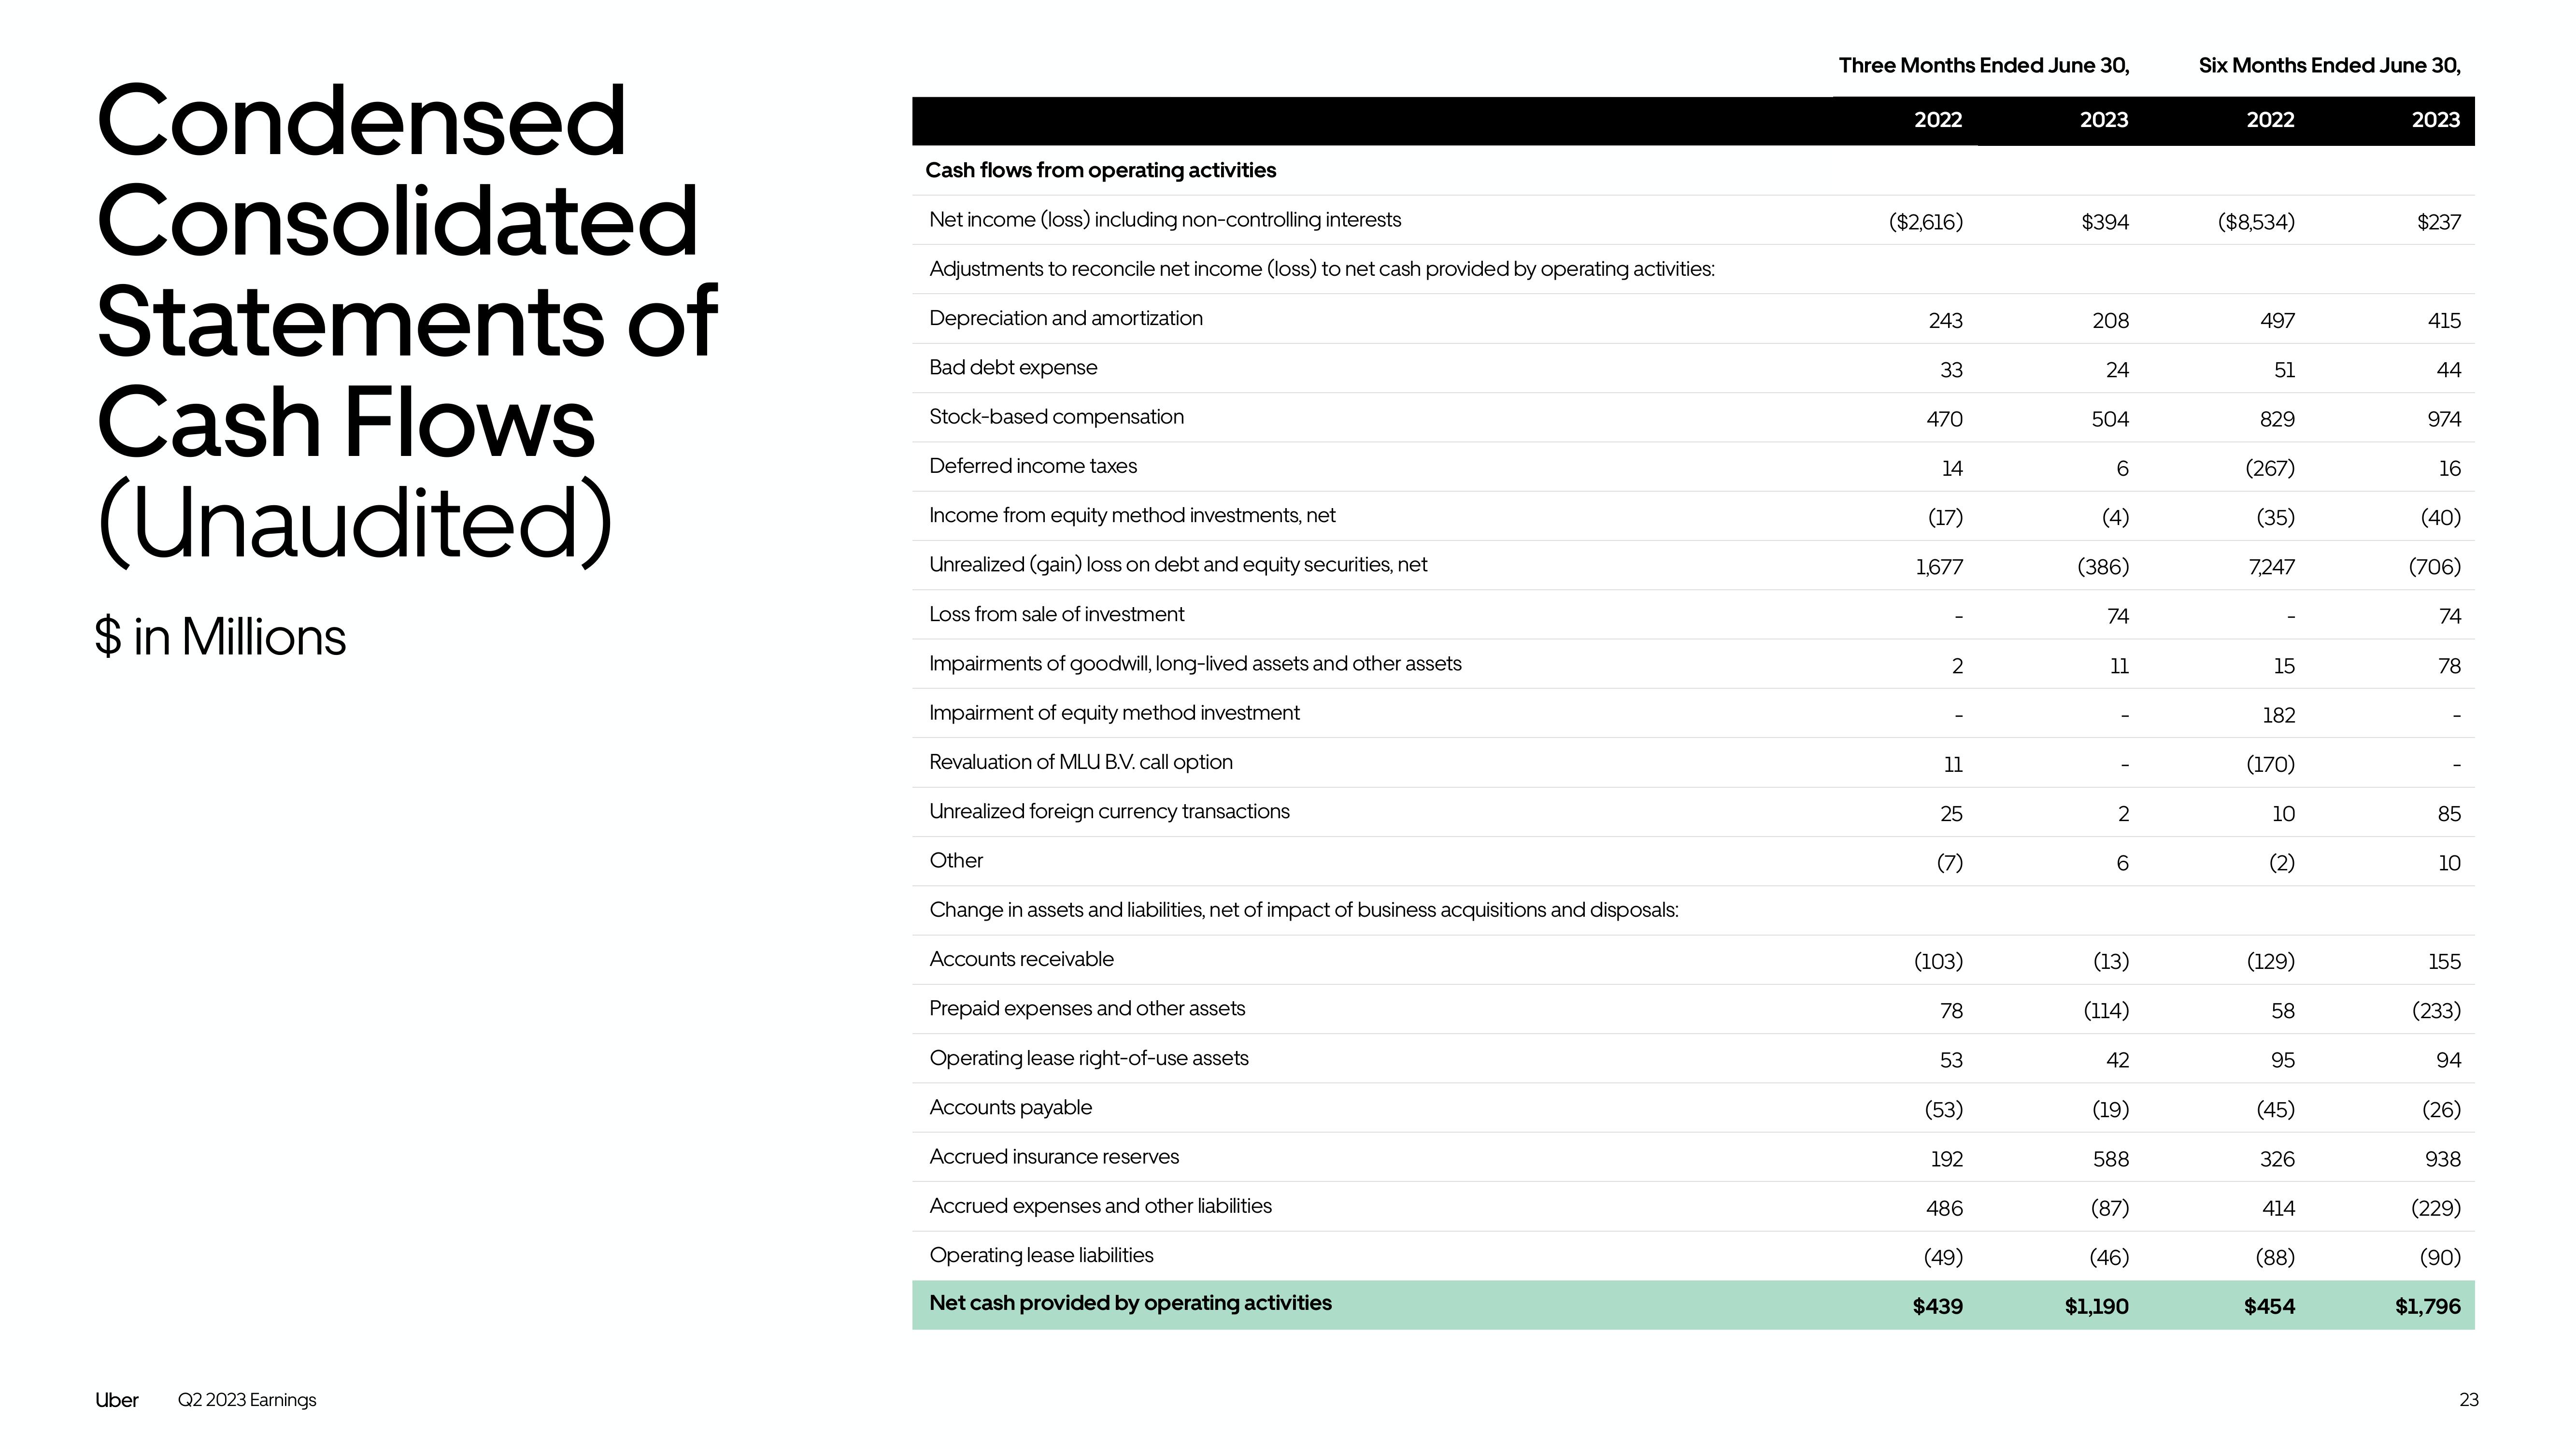
Condensed
Consolidated
Statements of
Cash Flows
(Unaudited)
$ in Millions
Uber Q2 2023 Earnings
Cash flows from operating activities
Net income (loss) including non-controlling interests
Adjustments to reconcile net income (loss) to net cash provided by operating activities:
Depreciation and amortization
Bad debt expense
Stock-based compensation
Deferred income taxes
Income from equity method investments, net
Unrealized (gain) loss on debt and equity securities, net
Loss from sale of investment
Impairments of goodwill, long-lived assets and other assets
Impairment of equity method investment
Revaluation of MLU B.V. call option
Unrealized foreign currency transactions
Other
Change in assets and liabilities, net of impact of business acquisitions and disposals:
Accounts receivable
Prepaid expenses and other assets
Operating lease right-of-use assets
Accounts payable
Accrued insurance reserves
Accrued expenses and other liabilities
Operating lease liabilities
Net cash provided by operating activities
Three Months Ended June 30,
2022
($2,616)
243
33
470
14
(17)
1,677
2
11
25
(7)
(103)
78
53
(53)
192
486
(49)
$439
2023
$394
208
24
504
6
(4)
(386)
74
11
2
6
(13)
(114)
42
(19)
588
(87)
(46)
$1,190
Six Months Ended June 30,
2022
($8,534)
497
51
829
(267)
(35)
7,247
15
182
(170)
10
(2)
(129)
58
95
(45)
326
414
(88)
$454
2023
$237
415
44
974
16
(40)
(706)
74
78
85
10
155
(233)
94
(26)
938
(229)
(90)
$1,796
23View entire presentation