Phreesia Investor Presentation Deck
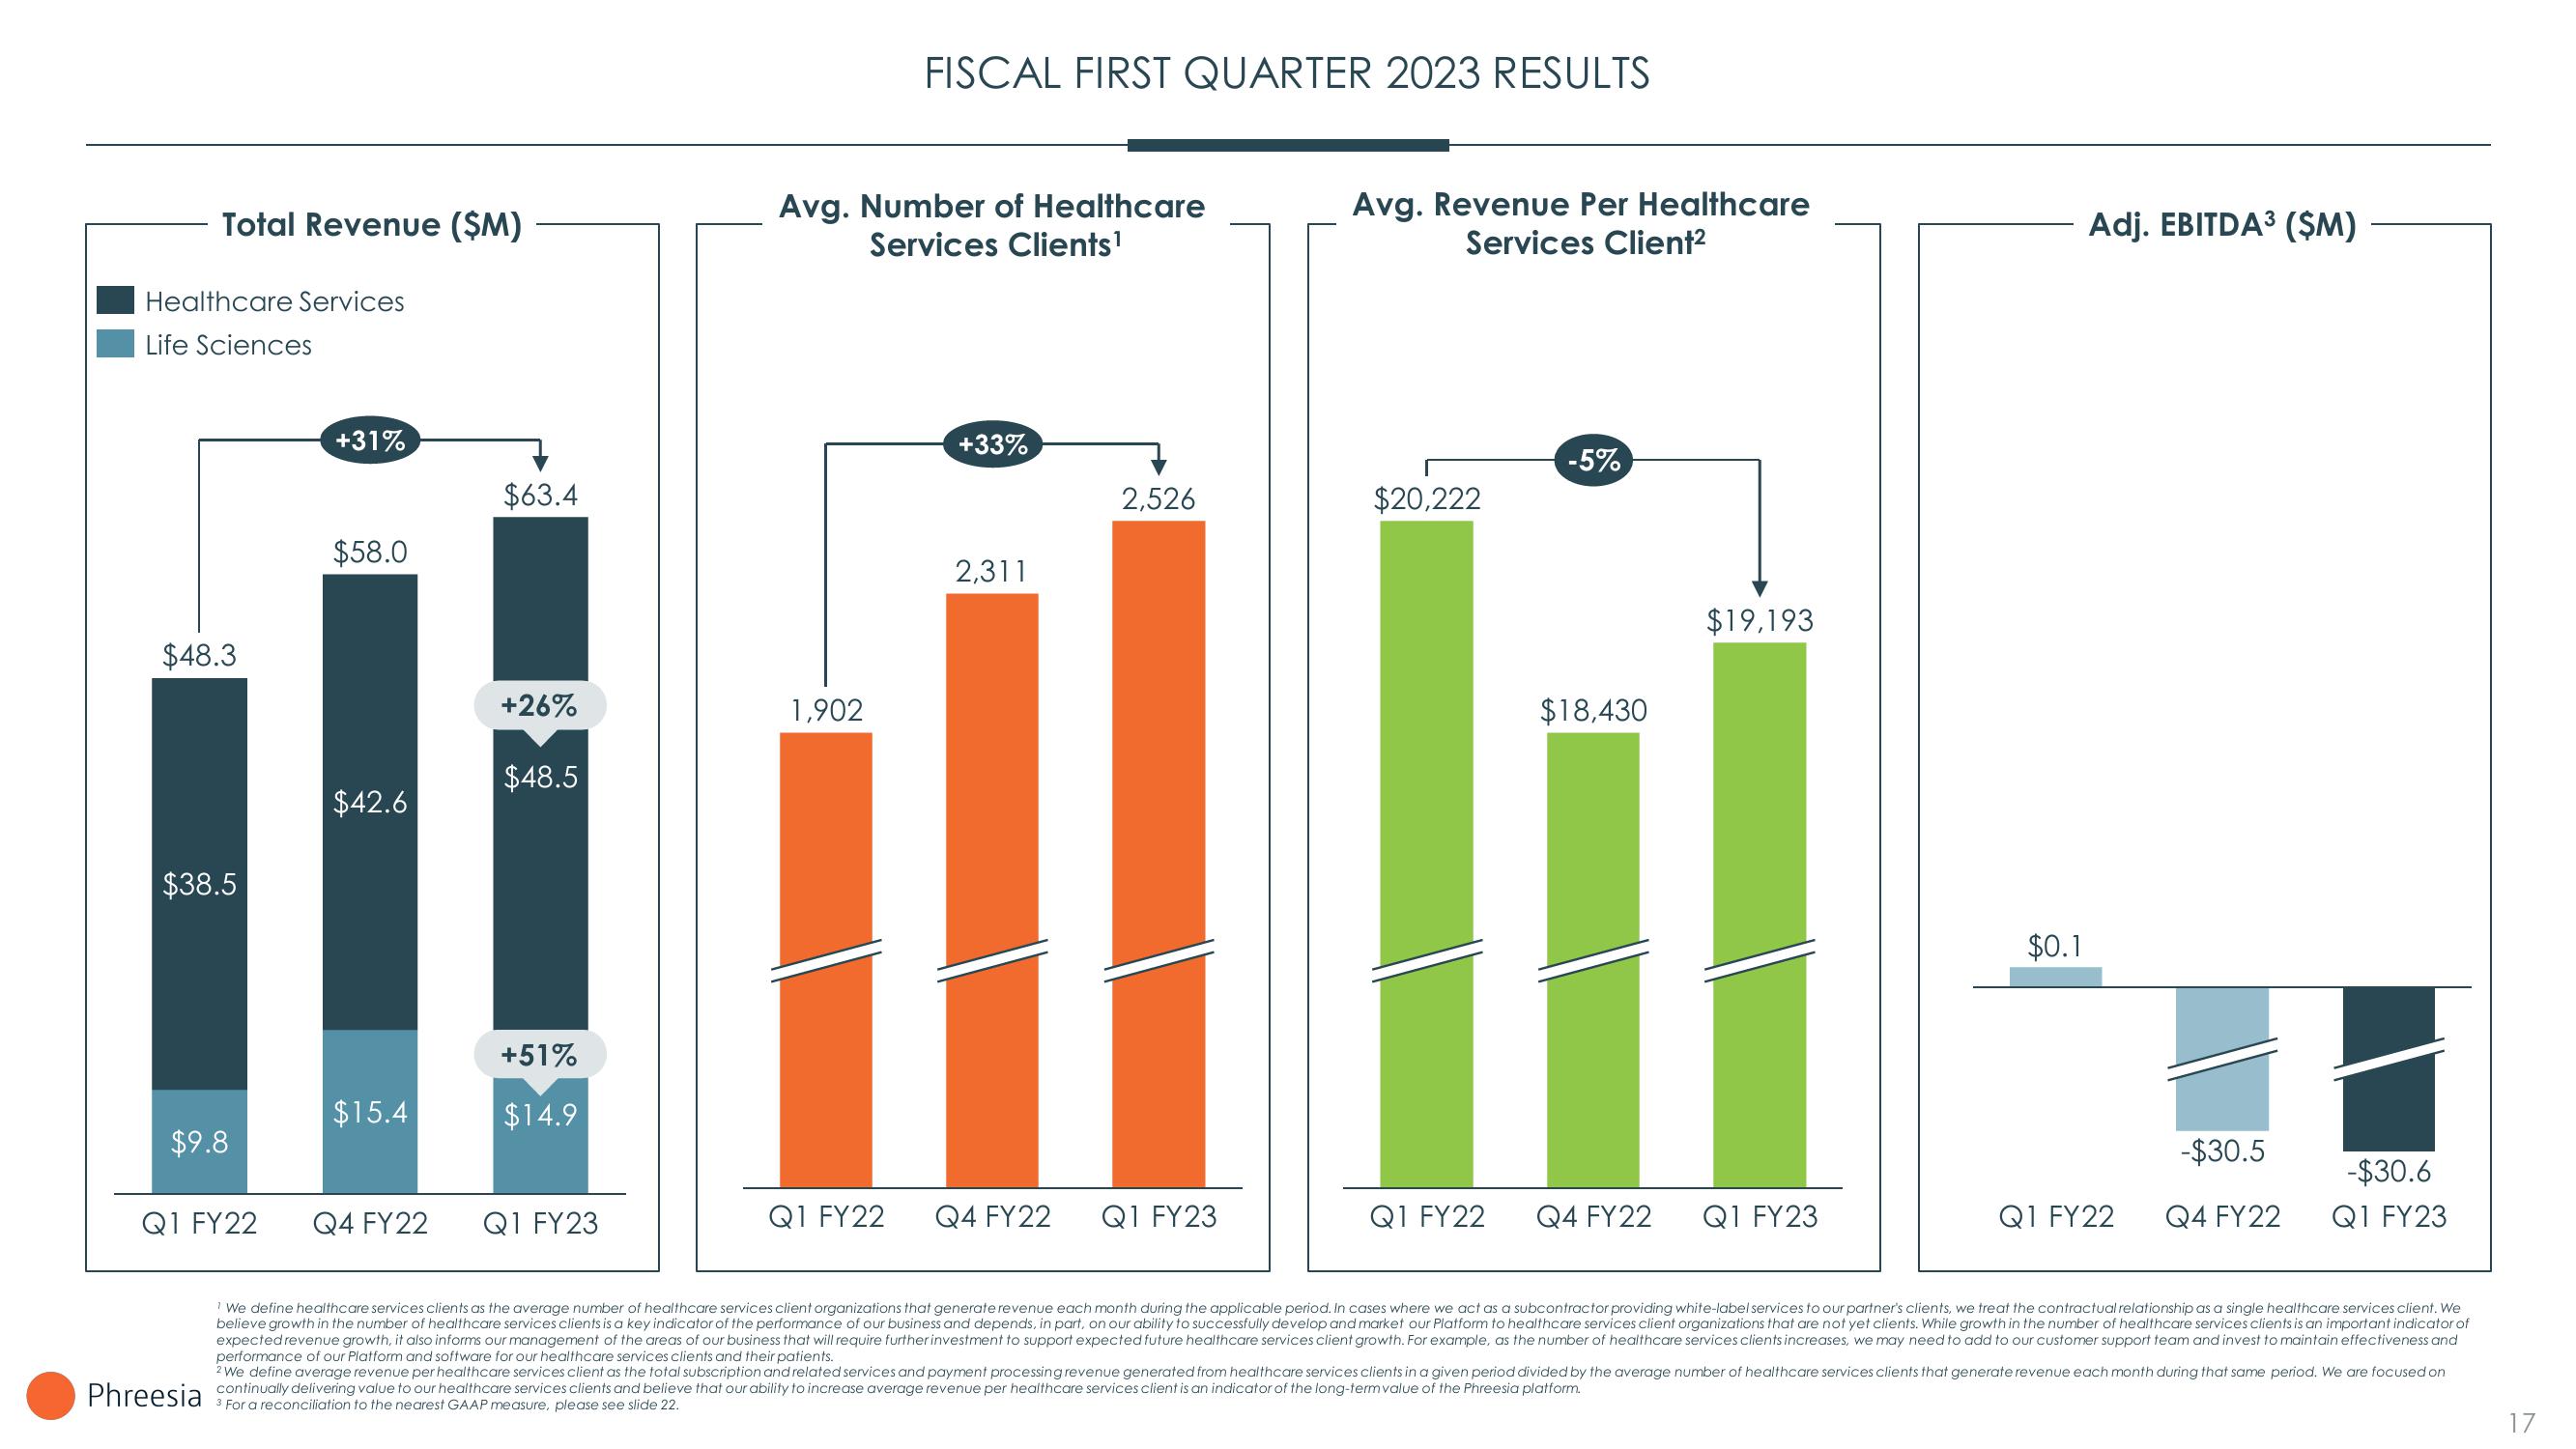
Total Revenue ($M)
Healthcare Services
Life Sciences
$48.3
$38.5
$9.8
Q1 FY22
+31%
$58.0
$42.6
$15.4
Q4 FY22
$63.4
+26%
$48.5
+51%
$14.9
Q1 FY23
Avg. Number of Healthcare
Services Clients¹
1,902
FISCAL FIRST QUARTER 2023 RESULTS
Q1 FY22
+33%
2,311
Q4 FY22
2,526
Q1 FY23
Avg. Revenue Per Healthcare
Services Client²
$20,222
Q1 FY22
-5%
$18,430
Q4 FY22
$19,193
Q1 FY23
$0.1
Adj. EBITDA³ (SM)
Q1 FY22
-$30.5
Q4 FY22
-$30.6
Q1 FY23
! We define healthcare services clients as the average number of healthcare services client organizations that generate revenue each month during the applicable period. In cases where we act as a subcontractor providing white-label services to our partner's clients, we treat the contractual relationship as a single healthcare services client. We
believe growth in the number of healthcare services clients is a key indicator of the performance of our business and depends, in part, on our ability to successfully develop and market our Platform to healthcare services client organizations that are not yet clients. While growth in the number of healthcare services clients is an important indicator of
expected revenue growth, it also informs our management of the areas of our business that will require further investment to support expected future healthcare services client growth. For example, as the number of healthcare services clients increases, we may need to add to our customer support team and invest to maintain effectiveness and
performance of our Platform and software for our healthcare services clients and their patients.
2 We define average revenue per healthcare services client as the total subscription and related services and payment processing revenue generated from healthcare services clients in a given period divided by the average number of healthcare services clients that generate revenue each month during that same period. We are focused on
Phreesia continually delivering value to our healthcare services clients and believe that our ability to increase average revenue per healthcare services client is an indicator of the long-term value of the Phreesia platform.
3 For reconciliation to the nearest GAAP measure, please see slide 22.
17View entire presentation