J.P.Morgan Results Presentation Deck
JPMORGAN CHASE & CO.
ASSET & WEALTH MANAGEMENT
FINANCIAL HIGHLIGHTS, CONTINUED
(in billions)
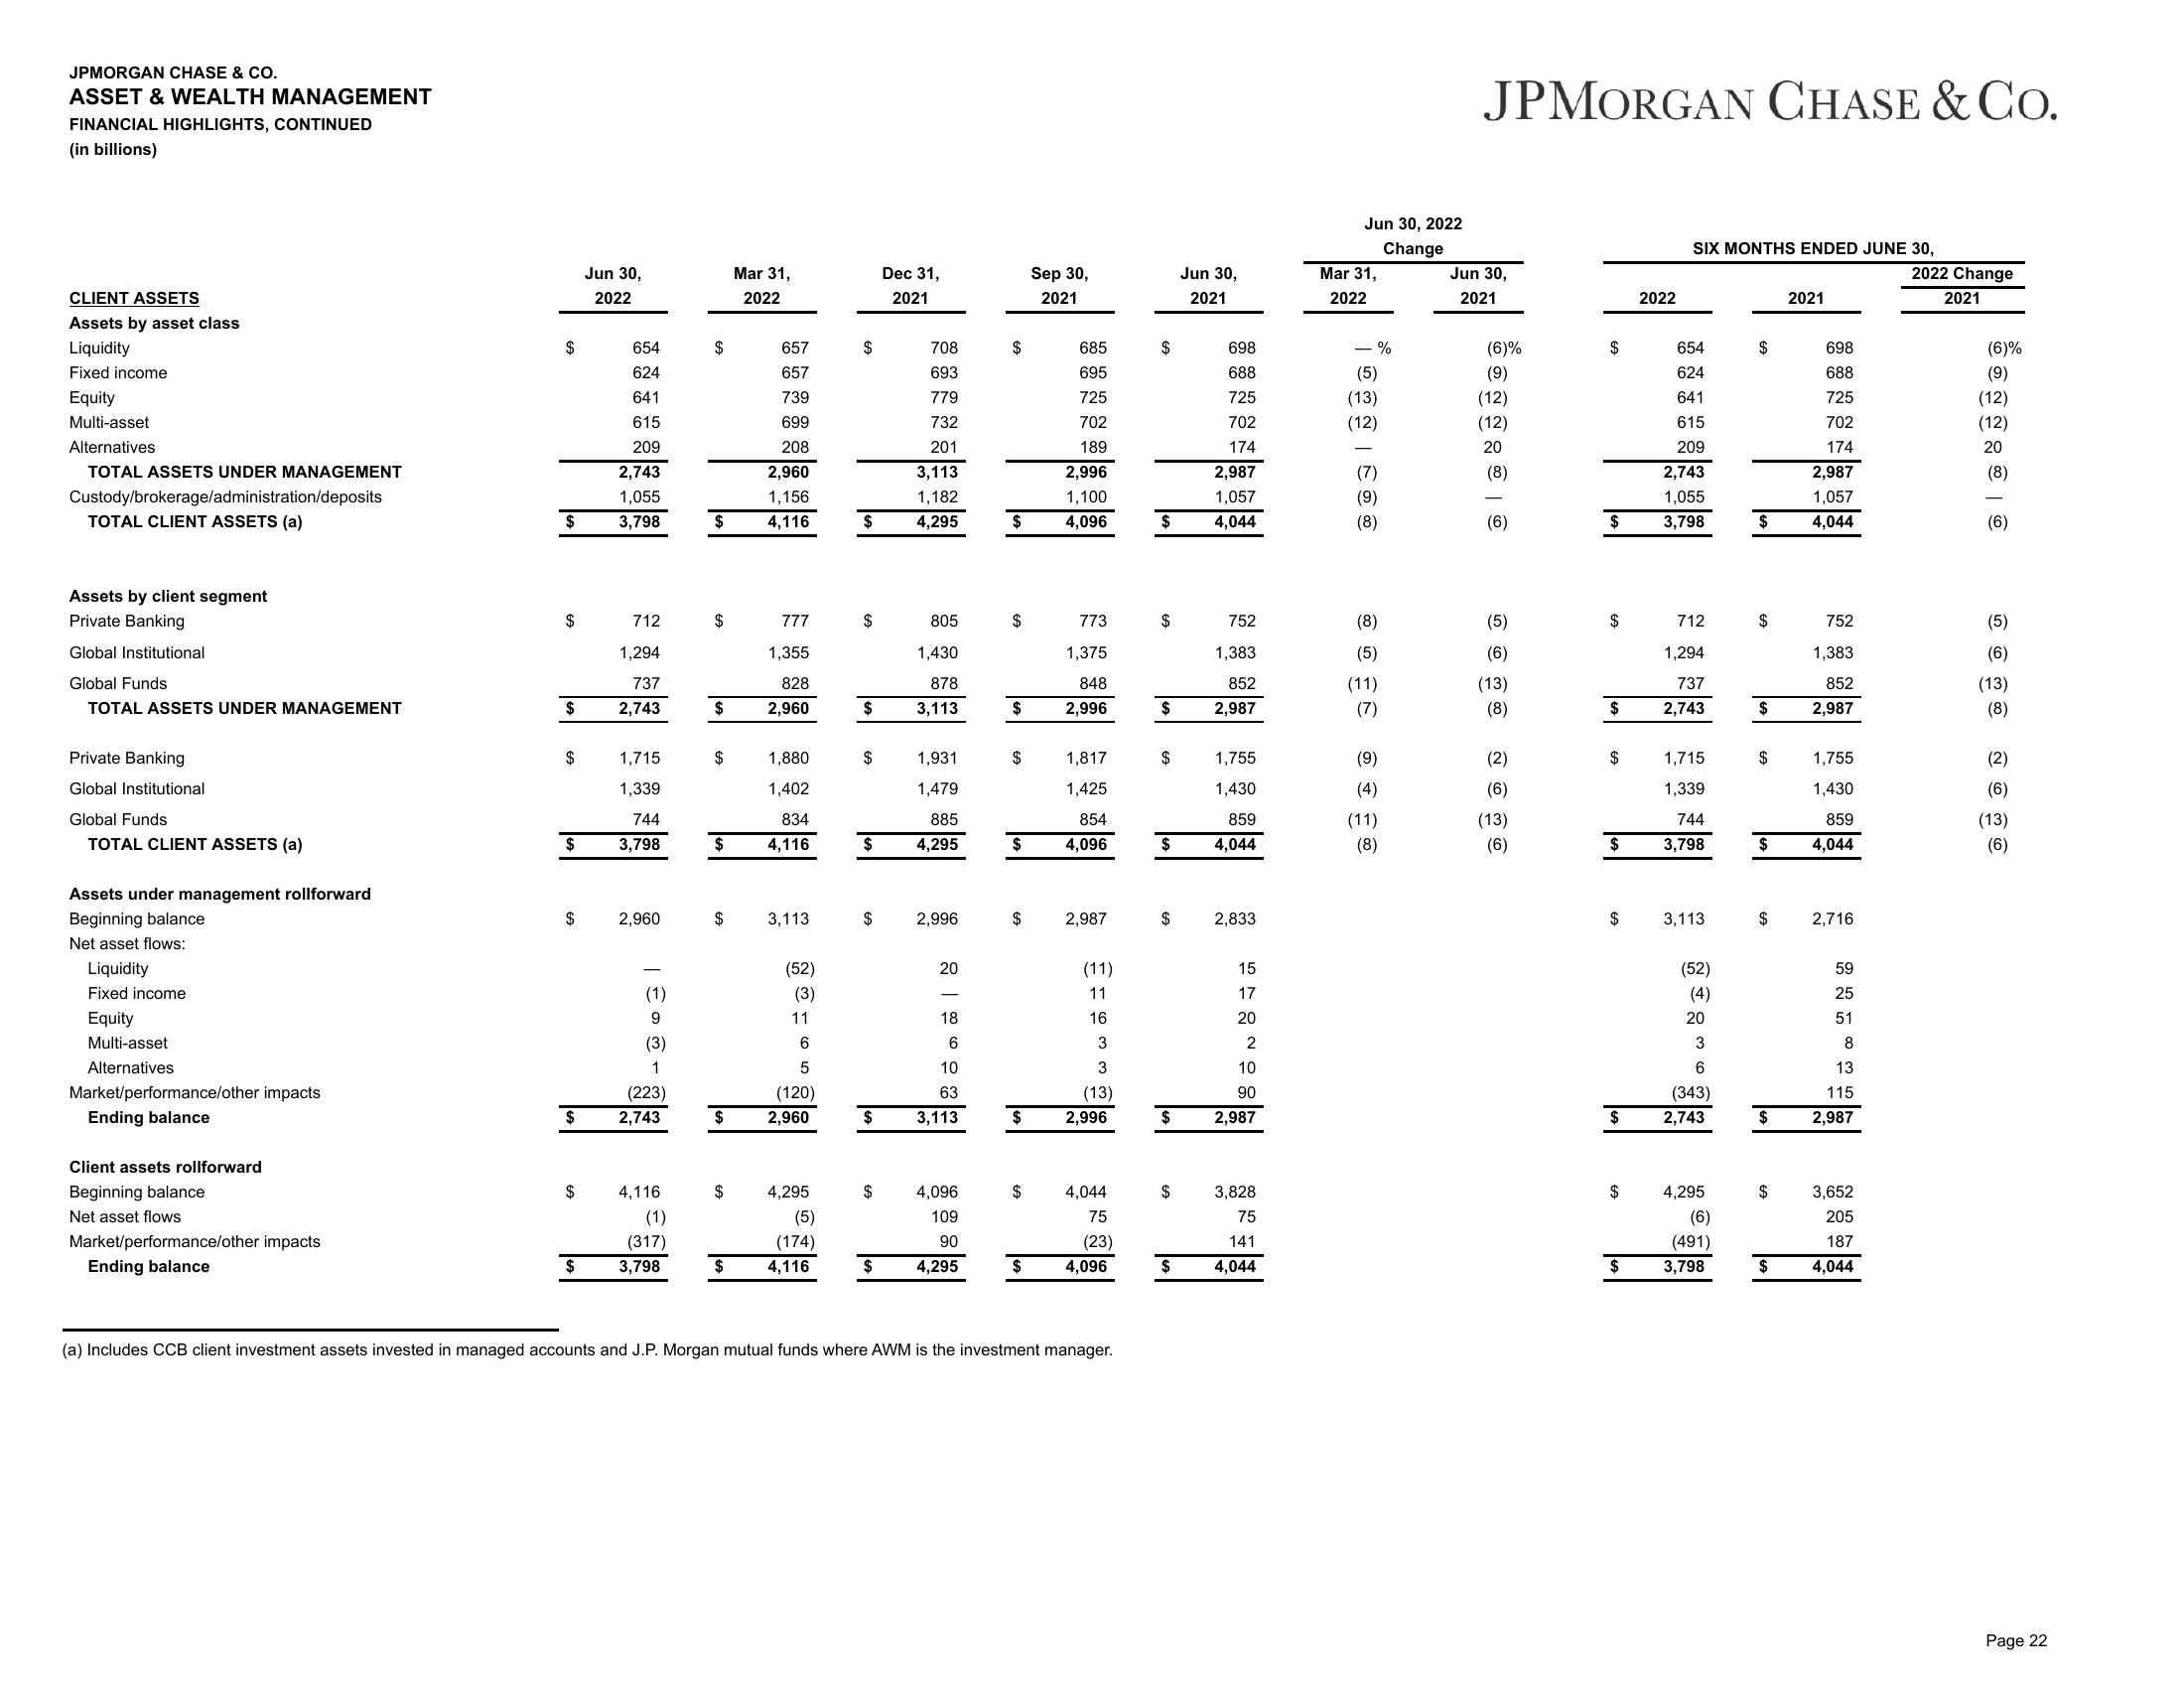
CLIENT ASSETS
Assets by asset class
Liquidity
Fixed income
Equity
Multi-asset
Alternatives
TOTAL ASSETS UNDER MANAGEMENT
Custody/brokerage/administration/deposits
TOTAL CLIENT ASSETS (a)
Assets by client segment
Private Banking
Global Institutional
Global Funds
TOTAL ASSETS UNDER MANAGEMENT
Private Banking
Global Institutional
Global Funds
TOTAL CLIENT ASSETS (a)
Assets under management rollforward
Beginning balance
Net asset flows:
Liquidity
Fixed income
Equity
Multi-asset
Alternatives
Market/performance/other impacts
Ending balance
Client assets rollforward
Beginning balance
Net asset flows
Market/performance/other impacts
Ending balance
$
$
$
$
712
1,294
737
$ 2,743
$
$
Jun 30,
2022
$
654
624
641
615
209
2,743
1,055
3,798
$
1,715
1,339
744
3,798
2,960
(223)
$ 2,743
(1)
9
(3)
1
4,116
(1)
(317)
3,798
$
$
$
$
$
$
$
$
$
$
Mar 31,
2022
657
657
739
699
208
2,960
1,156
4,116
777
1,355
828
2,960
1,880
1,402
834
4,116
3,113
(52)
(3)
11
6
5
(120)
2,960
4,295
(5)
(174)
4,116
$
$
$
$
$
$
$
$
Dec 31,
2021
$
708
693
779
732
201
3,113
1,182
4,295
805
1,430
878
3,113
1,931
1,479
885
4,295
2,996
20
18
6
10
63
3,113
4,096
109
90
$ 4,295
$
$
$
$
$
$
$
$
$
$
Sep 30,
2021
685
695
725
702
189
2,996
1,100
4,096
773
1,375
848
2,996
1,817
1,425
854
4,096
2,987
(11)
11
16
3
3
(13)
2,996
4,044
75
(23)
4,096
(a) Includes CCB client investment assets invested in managed accounts and J.P. Morgan mutual funds where AWM is the investment manager.
$
$
$
$
$
$
$
$
$
$
Jun 30,
2021
698
688
725
702
174
2,987
1,057
4,044
752
1,383
852
2,987
1,755
1,430
859
4,044
2,833
15
17
20
2
10
90
2,987
3,828
75
141
4,044
Jun 30, 2022
Change
Mar 31,
2022
%
(5)
(13)
(12)
(9)
(8)
(8)
(5)
(11)
(7)
(9)
(4)
(11)
(8)
JPMORGAN CHASE & CO.
Jun 30,
2021
(6)%
(9)
(12)
(12)
20
(8)
(6)
(5)
(6)
(13)
(8)
(2)
(6)
(13)
(6)
$
$
$
$
$
$
$
$
$
2022
SIX MONTHS ENDED JUNE 30,
654
624
641
615
209
2,743
1,055
3,798
712
1,294
737
2,743
1,715
1,339
744
3,798
3,113
(52)
(4)
20
3
6
(343)
2,743
4,295
(6)
(491)
3,798
$
$
$
$
$
$
$
$
$
$
2021
698
688
725
702
174
2,987
1,057
4,044
752
1,383
852
2,987
1,755
1,430
859
4,044
2,716
59
25
51
8
13
115
2,987
3,652
205
187
4,044
2022 Change
2021
(6)%
(9)
(12)
(12)
20
(8)
(6)
(5)
(6)
(13)
(8)
(2)
(6)
(13)
(6)
Page 22View entire presentation