Rent The Runway Results Presentation Deck
Operating
Expense Detail
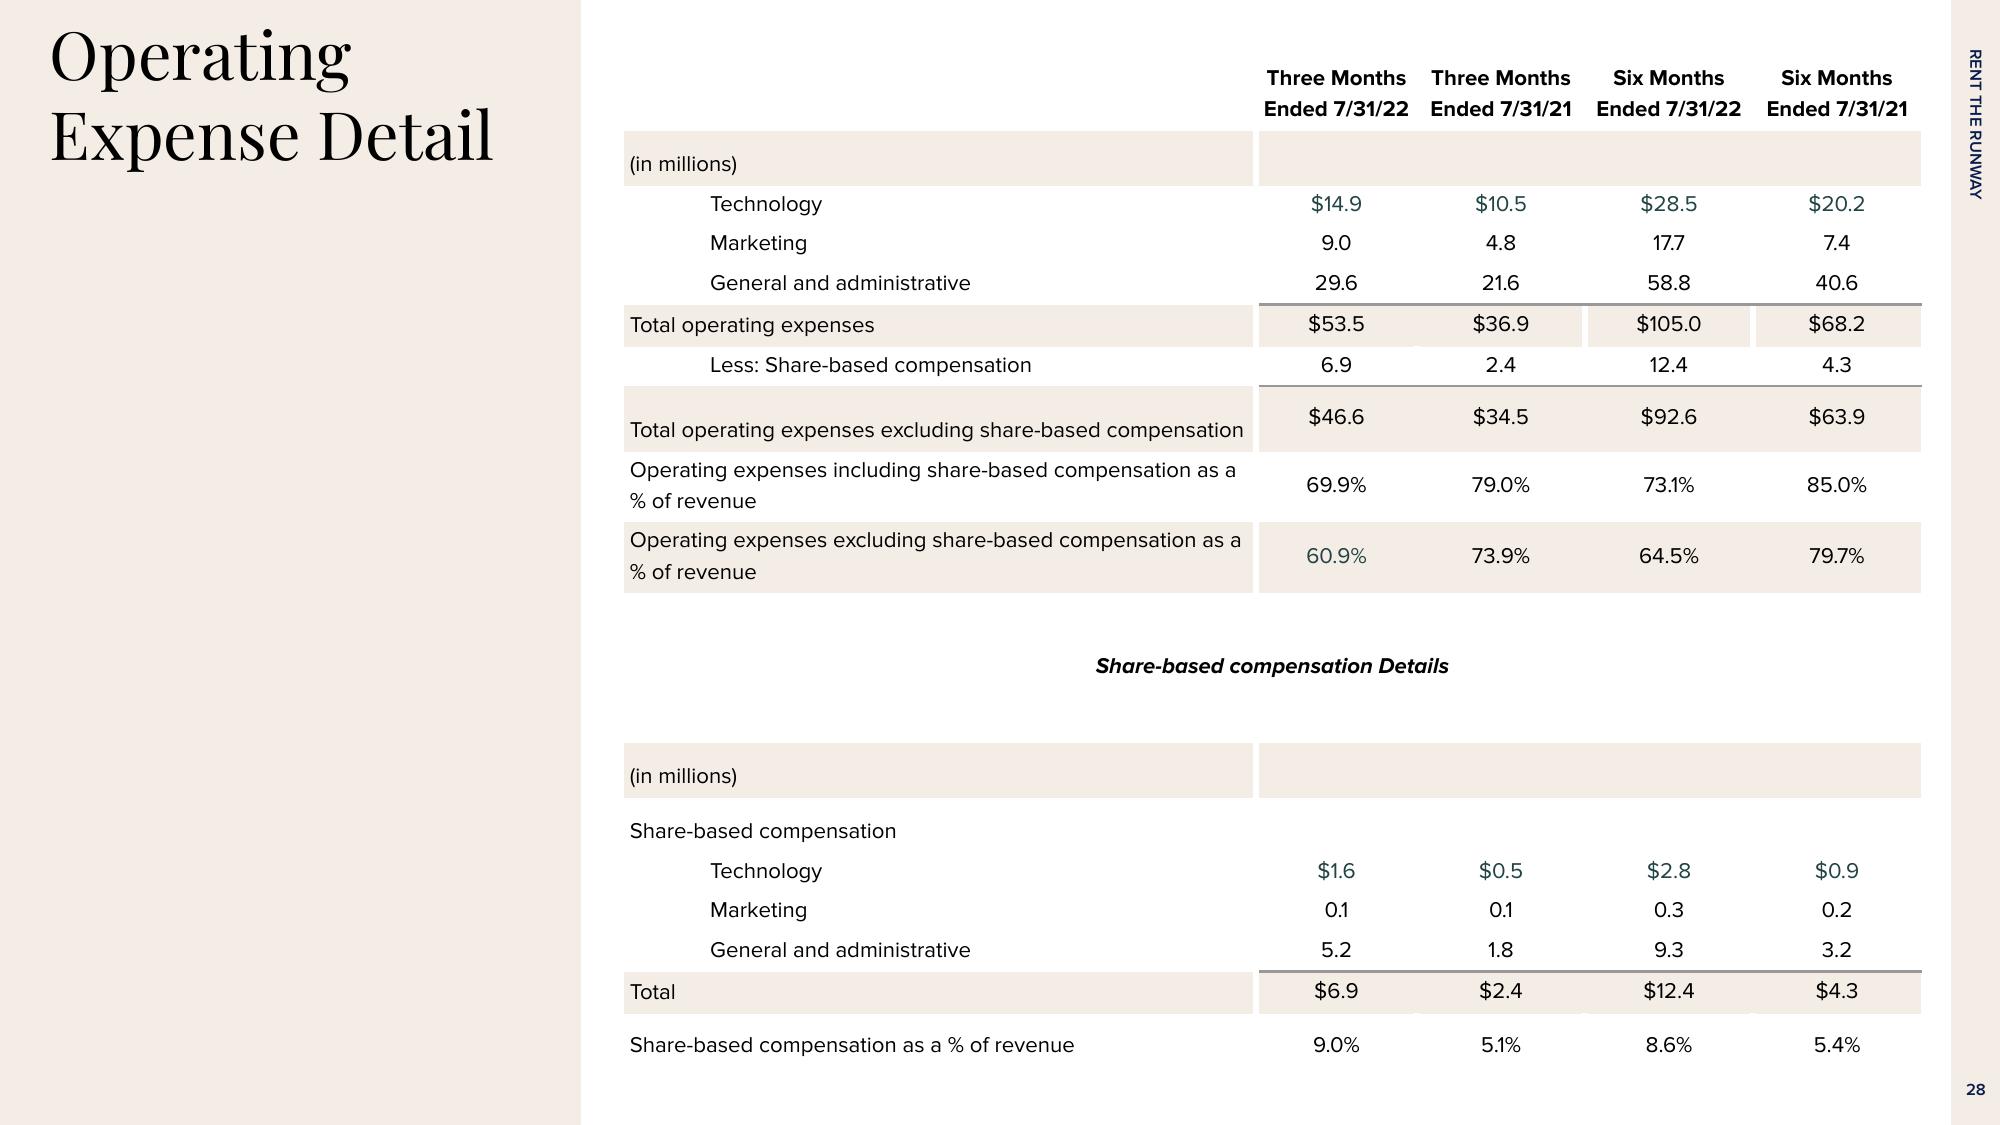
(in millions)
Technology
Marketing
General and administrative
Total operating expenses
Less: Share-based compensation
Total operating expenses excluding share-based compensation
Operating expenses including share-based compensation as a
% of revenue
Operating expenses excluding share-based compensation as a
% of revenue
Total
(in millions)
Share-based compensation
Technology
Marketing
General and administrative
Share-based compensation as a % of revenue
Three Months Three Months
Ended 7/31/22 Ended 7/31/21
$14.9
9.0
29.6
$53.5
6.9
$46.6
69.9%
60.9%
Share-based compensation Details
$1.6
0.1
5.2
$6.9
9.0%
$10.5
4.8
21.6
$36.9
2.4
$34.5
79.0%
73.9%
$0.5
0.1
1.8
$2.4
5.1%
Six Months
Ended 7/31/22
$28.5
17.7
58.8
$105.0
12.4
$92.6
73.1%
64.5%
$2.8
0.3
9.3
$12.4
8.6%
Six Months
Ended 7/31/21
$20.2
7.4
40.6
$68.2
4.3
$63.9
85.0%
79.7%
$0.9
0.2
3.2
$4.3
5.4%
RENT THE RUNWAY
28View entire presentation