Crowdstrike Investor Day Presentation Deck
Revenue
Subscription
Professional services
Total revenue
Cost of revenue
Subscription
Professional services
Total cost of revenue
Gross profit
Subscription
Professional services
Total gross profit
Operating expenses
Sales and marketing
Research and development
General and administrative
Total operating expenses
Loss from operations
Interest expense
Other income, net
Loss before provision for income taxes
Provision for income taxes
Net loss
Net income attributable to noncontrolling interest
Net loss attributable to CrowdStrike
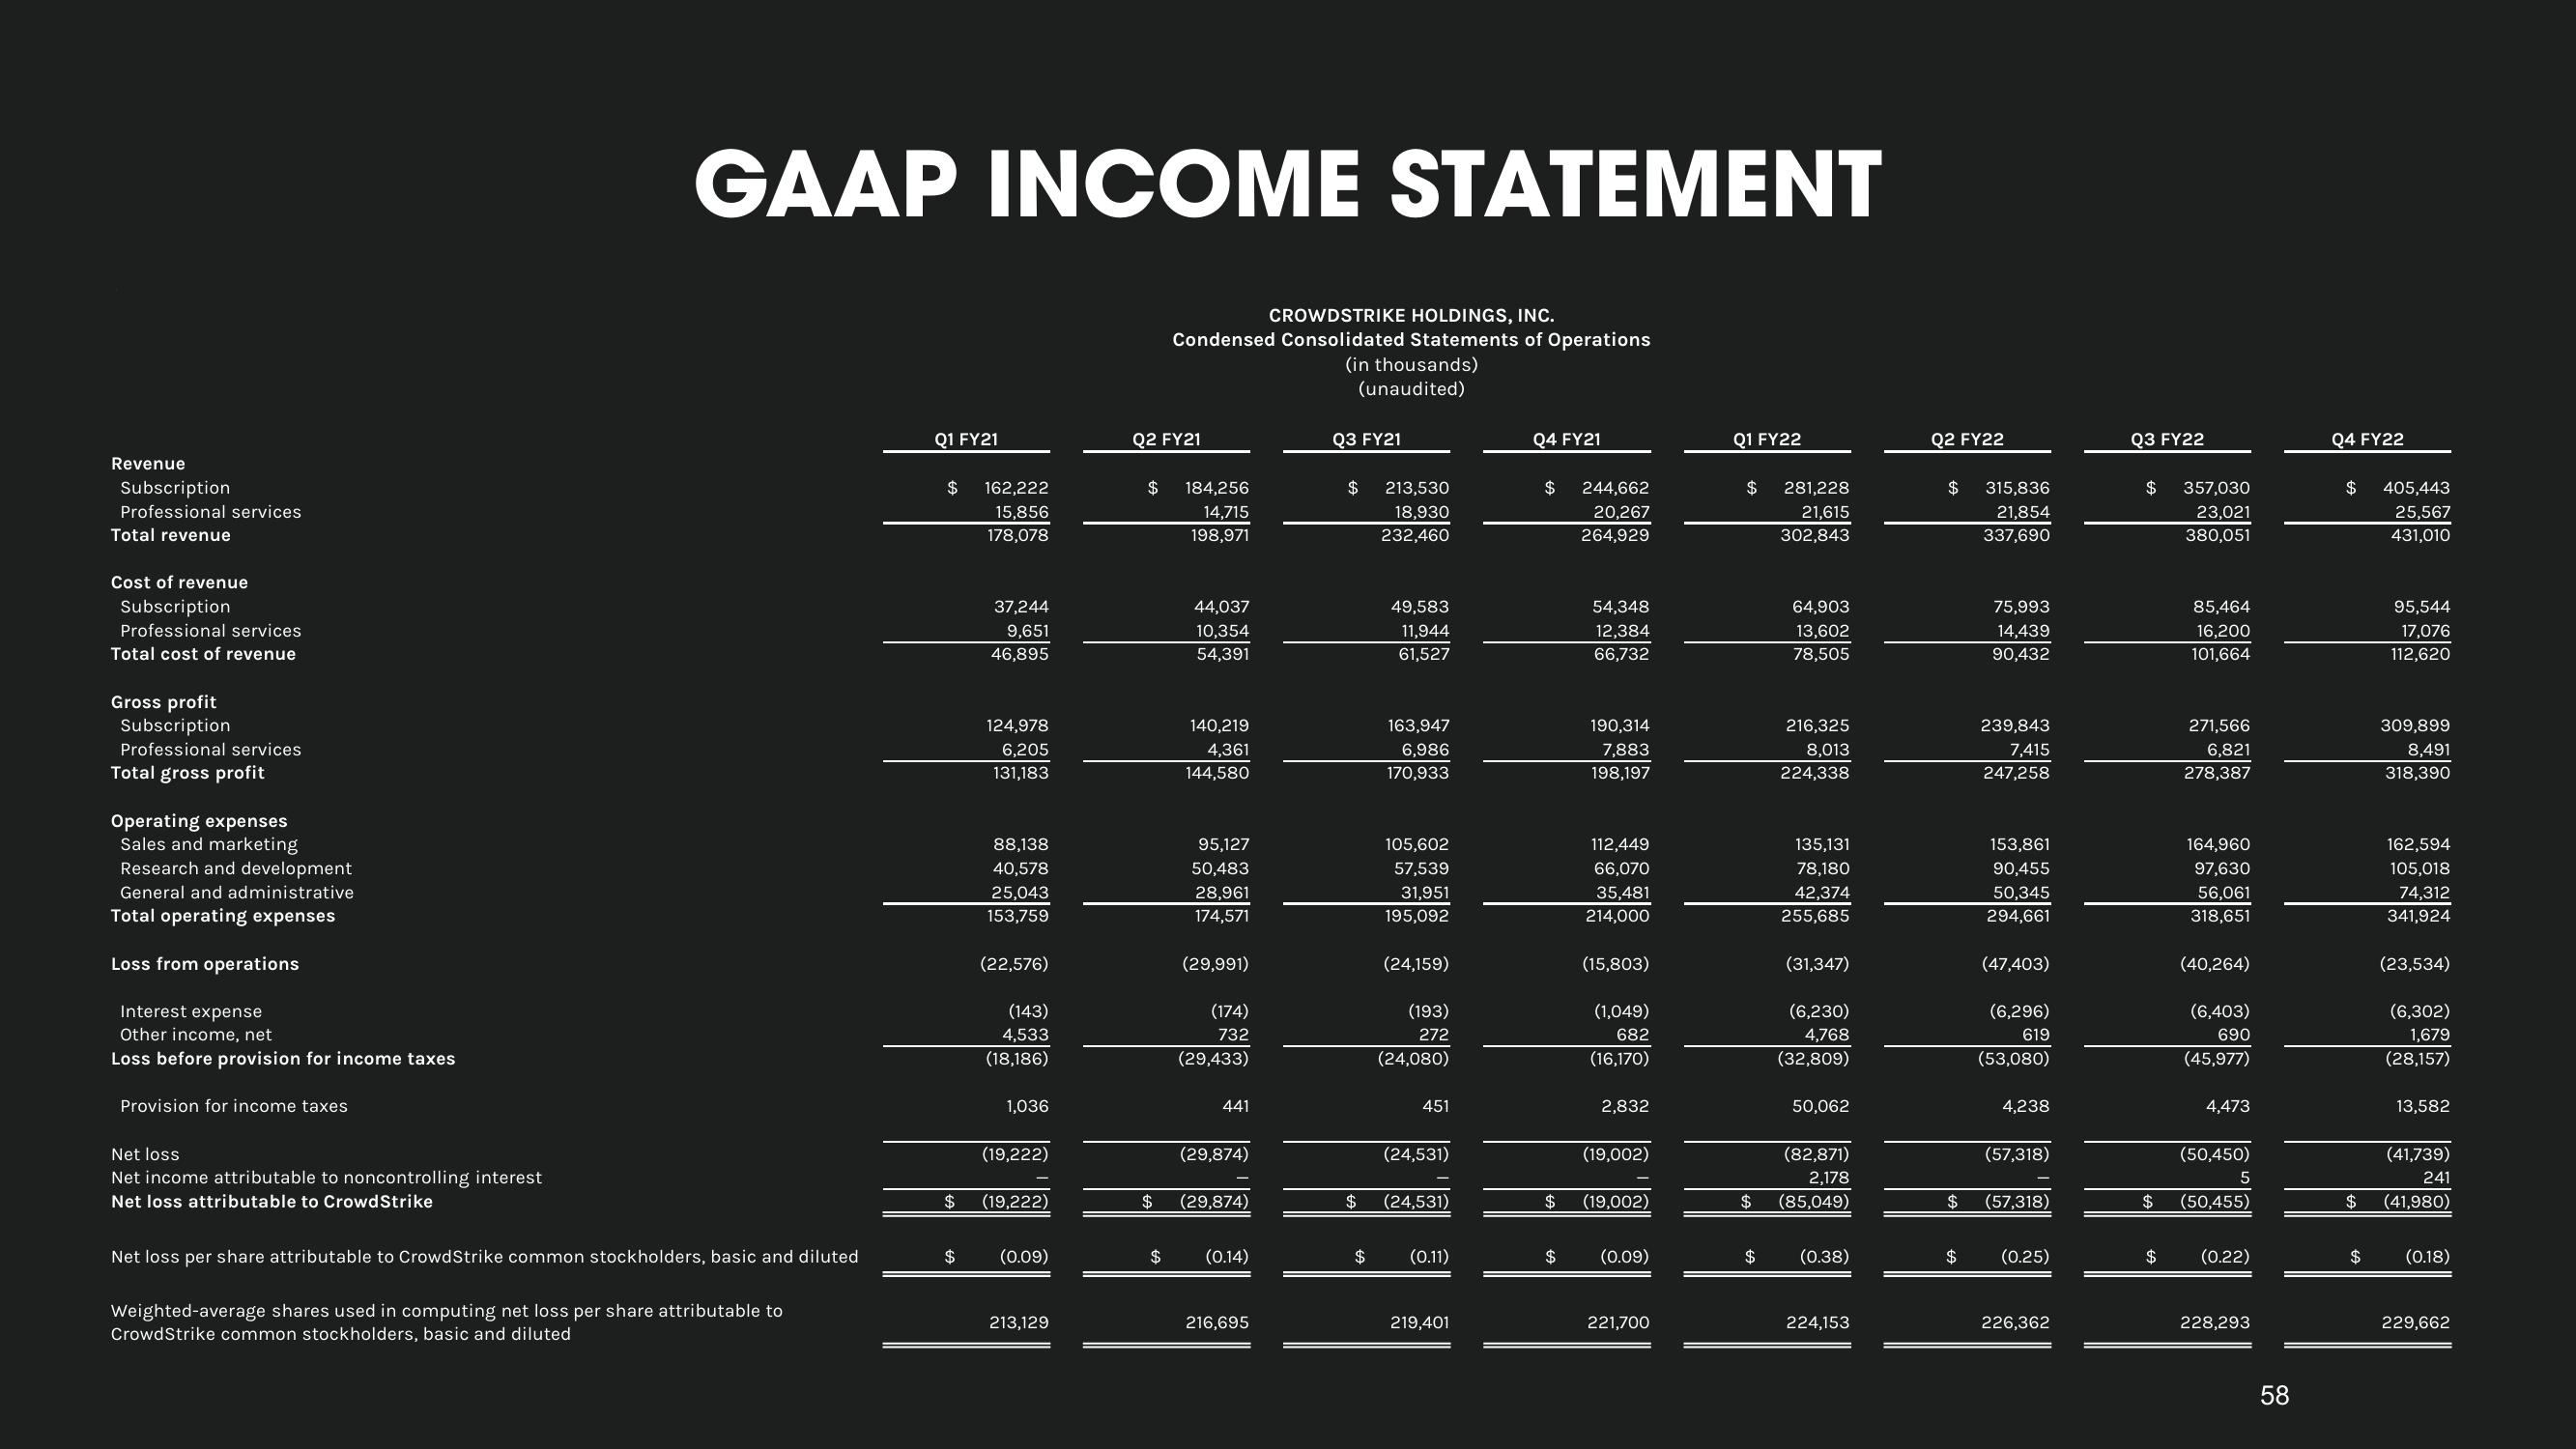
GAAP INCOME STATEMENT
Net loss per share attributable to CrowdStrike common stockholders, basic and diluted
Weighted-average shares used in computing net loss per share attributable to
CrowdStrike common stockholders, basic and diluted
Q1 FY21
$ 162,222
15,856
178,078
$
$
37,244
9,651
46,895
124,978
6,205
131,183
88,138
40,578
25,043
153,759
(22,576)
(143)
4,533
(18,186)
1,036
(19,222)
(19,222)
(0.09)
213,129
Q2 FY21
CROWDSTRIKE HOLDINGS, INC.
Condensed Consolidated Statements of Operations
(in thousands)
(unaudited)
$ 184,256
14,715
198,971
$
$
44,037
10,354
54,391
140,219
4,361
144,580
50,483
28,961
174,571
(29,991)
(174)
732
(29,433)
441
(29,874)
(29,874)
(0.14)
216,695
Q3 FY21
$ 213,530
18,930
232,460
49,583
11,944
61,527
163,947
6,986
170,933
05,6
57,539
31,951
195,092
(24,159)
(193)
272
(24,080)
451
(24,531)
$ (24,531)
$ (0.11)
219,401
Q4 FY21
$
$
244,662
20,267
264,929
54,348
12,384
66,732
190,314
7,883
198,197
112,4
66,070
35,481
214,000
(15,803)
(1,049)
682
(16,170)
2,832
(19,002)
(19,002)
(0.09)
221,700
Q1 FY22
$
281,228
21,615
302,843
64,903
13,602
78,505
216,325
8,013
224,338
131
78,180
42,374
255,685
(31,347)
(6,230)
4,768
(32,809)
50,062
(82,871)
2,178
$ (85,049)
$ (0.38)
224,153
Q2 FY22
$ 315,836
21,854
337,690
$
$
75,993
14,439
90,432
239,843
7,415
247,258
361
90,455
50,345
294,661
(47,403)
(6,296)
619
(53,080)
4,238
(57,318)
(57,318)
(0.25)
226,362
Q3 FY22
$ 357,030
23,021
380,051
85,464
16,200
101,664
$
271,566
6,821
278,387
164,960
97,630
56,061
318,651
(40,264)
(6,403)
690
(45,977)
4,473
(50,450)
5
$ (50,455)
(0.22)
228,293
58
Q4 FY22
$
$
$
405,443
25,567
431,010
95,544
17,076
112,620
309,899
8,491
318,390
594
105,018
74,312
341,924
(23,534)
(6,302)
1,679
(28,157)
13,582
(41,739)
241
(41,980)
(0.18)
229,662View entire presentation