Acast Results Presentation Deck
Group financial KPI's and alternative
performance
measures
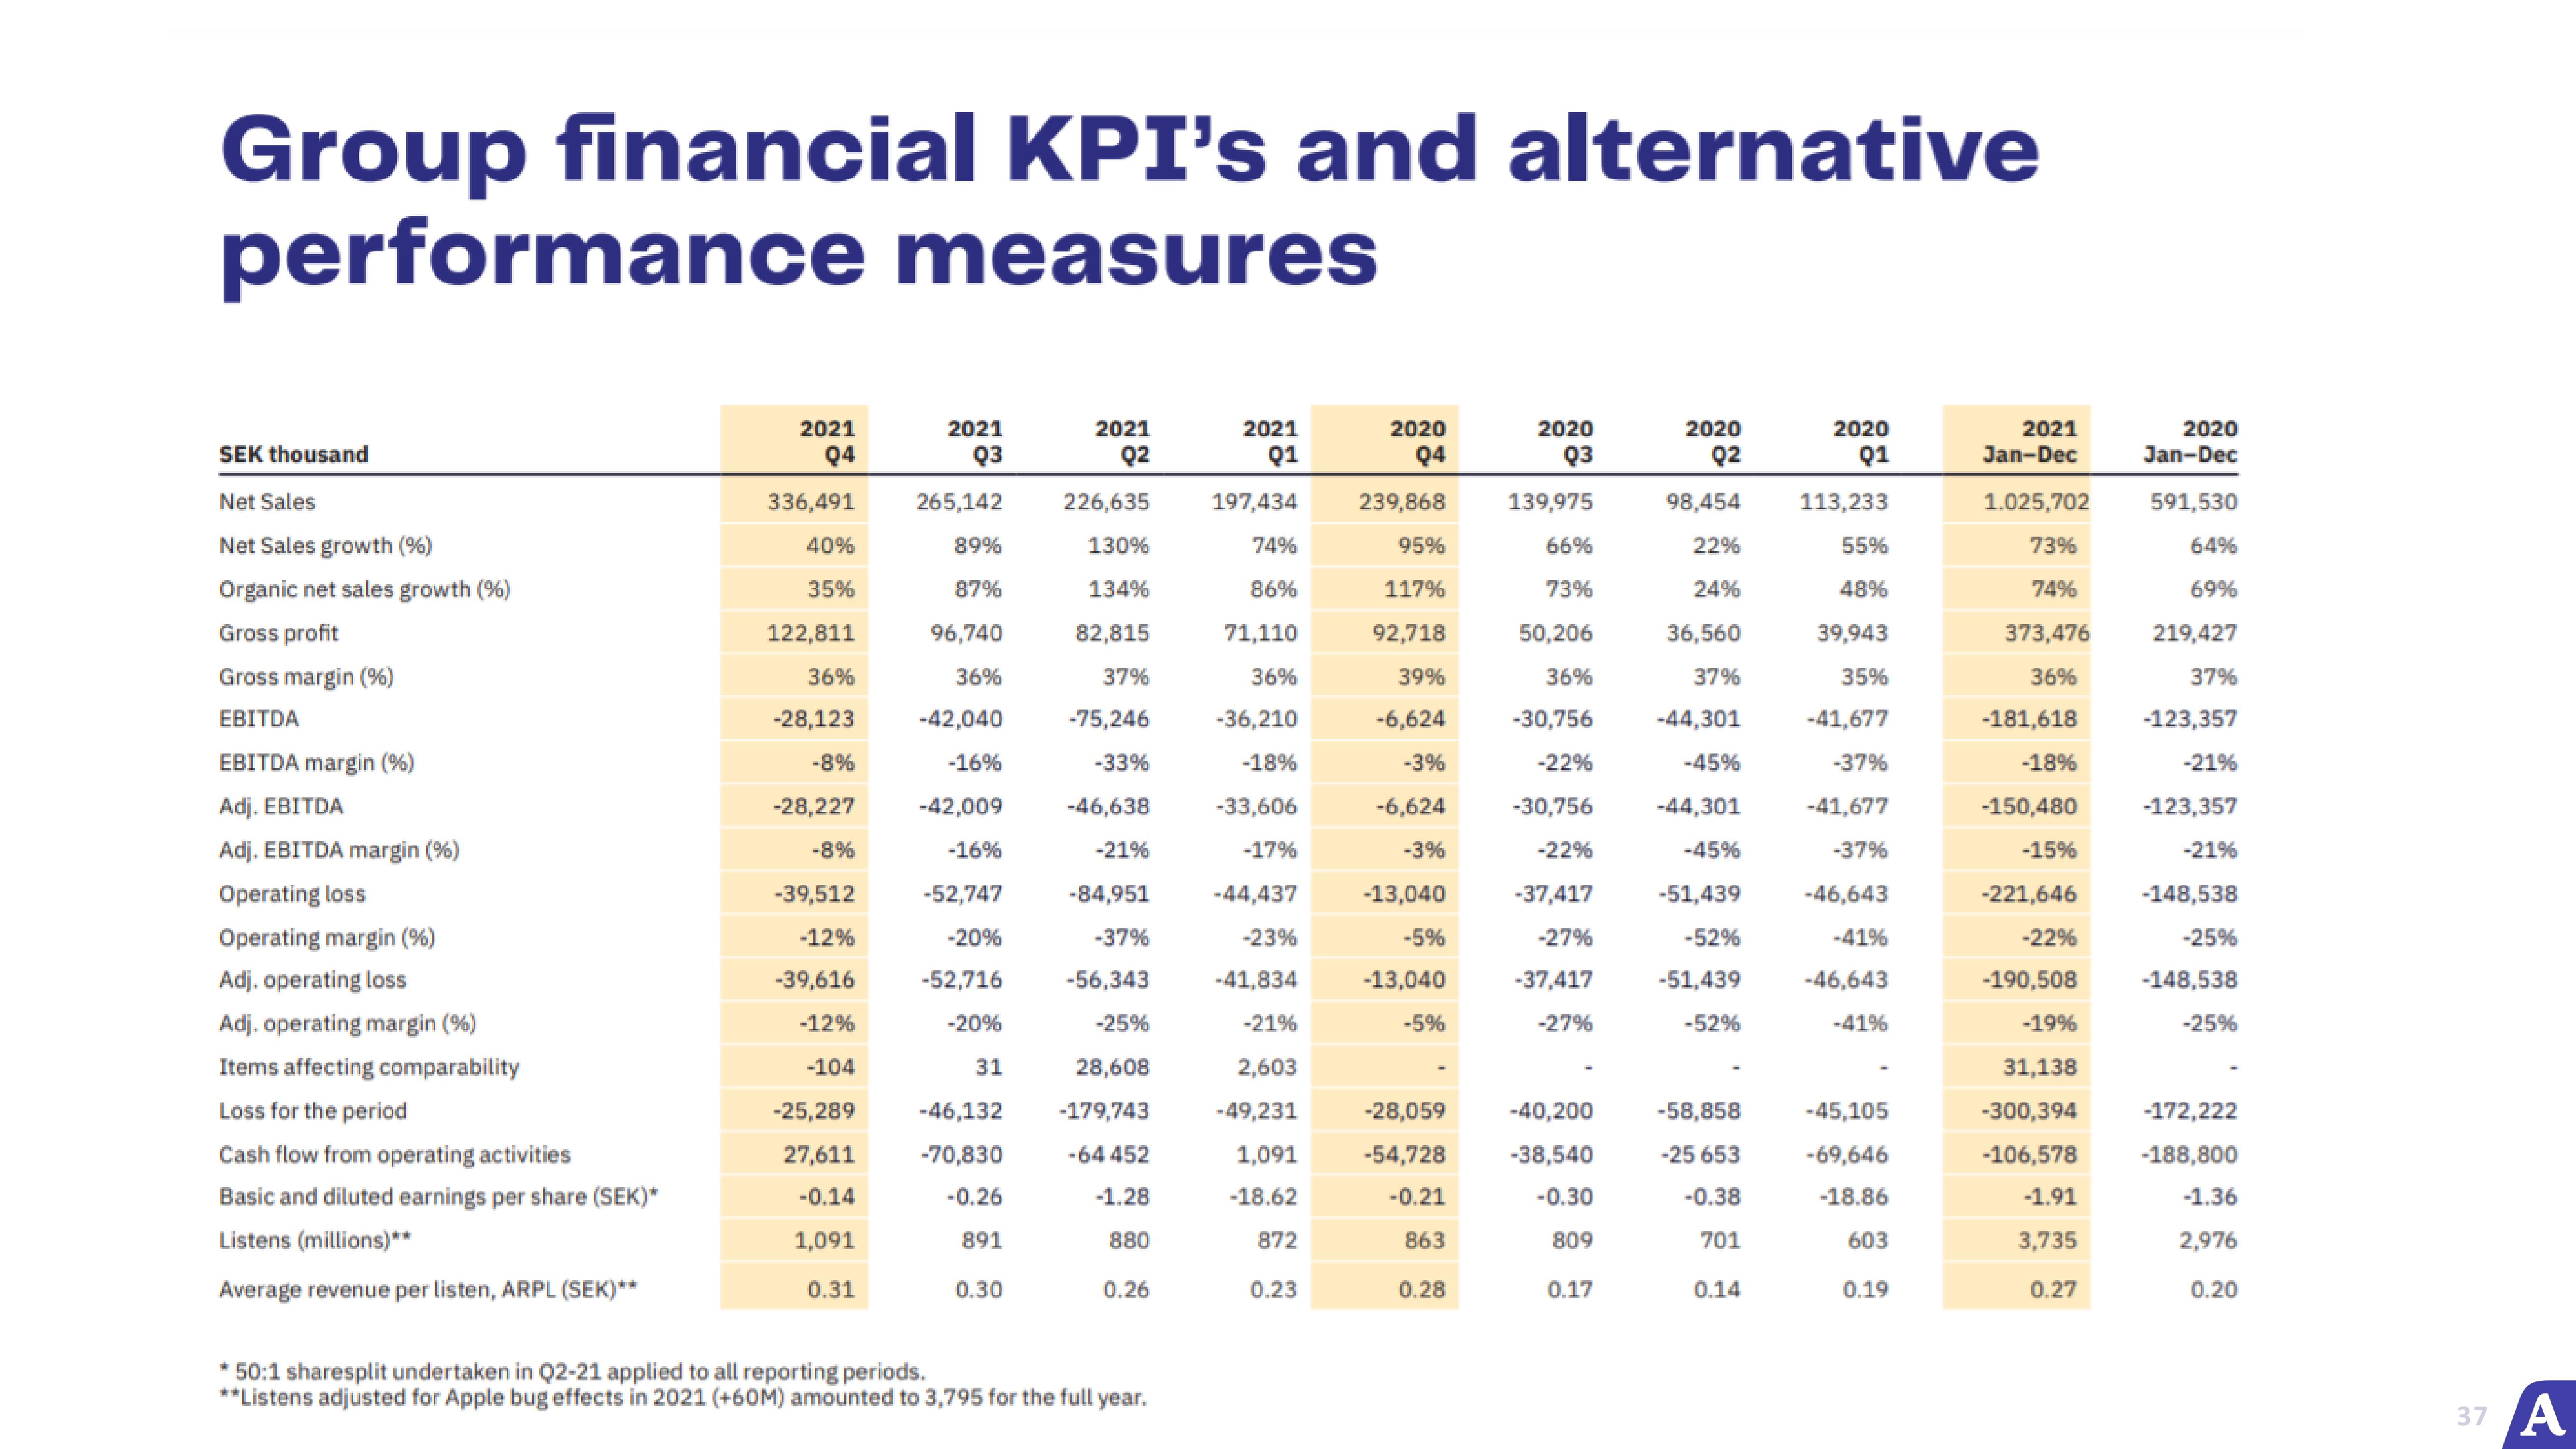
SEK thousand
Net Sales
Net Sales growth (%)
Organic net sales growth (%)
Gross profit
Gross margin (%)
EBITDA
EBITDA margin (%)
Adj. EBITDA
Adj. EBITDA margin (%)
Operating loss
Operating margin (%)
Adj. operating loss
Adj. operating margin (%)
Items affecting comparability
Loss for the period
Cash flow from operating activities
Basic and diluted earnings per share (SEK)*
Listens (millions)**
Average revenue per listen, ARPL (SEK)**
2021
Q4
336,491
40%
35%
122,811
36%
-28,123
-8%
-28,227
-8%
-39,512
-12%
-39,616
-12%
-104
-25,289
27,611
-0.14
1,091
0.31
2021
Q3
265,142
89%
87%
96,740
36%
-42,040
-16%
-42,009
-16%
-52,747
-20%
-52,716
-20%
31
-46,132
-70,830
-0.26
891
0.30
2021
Q2
226,635
130%
134%
82,815
37%
-75,246
-33%
-46,638
-21%
-84,951
-37%
-56,343
-25%
28,608
-179,743
-64 452
-1.28
880
0.26
* 50:1 sharesplit undertaken in Q2-21 applied to all reporting periods.
**Listens adjusted for Apple bug effects in 2021 (+60M) amounted to 3,795 for the full year.
2021
Q1
197,434
74%
86%
71,110
36%
-36,210
-18%
-33,606
-17%
-44,437
-23%
-41,834
-21%
2,603
-49,231
1,091
-18.62
872
0.23
2020
Q4
239,868
95%
117%
92,718
39%
-6,624
-3%
-6,624
-3%
-13,040
-5%
-13,040
-5%
-28,059
-54,728
-0.21
863
0.28
2020
Q3
139,975
66%
73%
50,206
36%
-30,756
-22%
-30,756
-22%
-37,417
-27%
-37,417
-27%
-40,200
-38,540
-0.30
809
0.17
2020
Q2
98,454 113,233
22%
24%
36,560
37%
-44,301
-45%
-44,301
-45%
-51,439
-52%
-51,439
-52%
55%
48%
39,943
35%
-41,677
-37%
-41,677
-37%
-46,643
-41%
-46,643
-41%
-58,858
-25 653
-0.38
701
2020
Q1
0.14
-45,105
-69,646
-18.86
603
0.19
2021
Jan-Dec
1.025,702
73%
74%
373,476
36%
-181,618
-18%
-150,480
-15%
-221,646
-22%
-190,508
-19%
31,138
-300,394
-106,578
-1.91
3,735
0.27
2020
Jan-Dec
591,530
64%
69%
219,427
37%
-123,357
-21%
-123,357
-21%
-148,538
-25%
-148,538
-25%
-172,222
-188,800
-1.36
2,976
0.20
37 AView entire presentation