Supplemental Financial Information Q1 Fiscal Year 2024
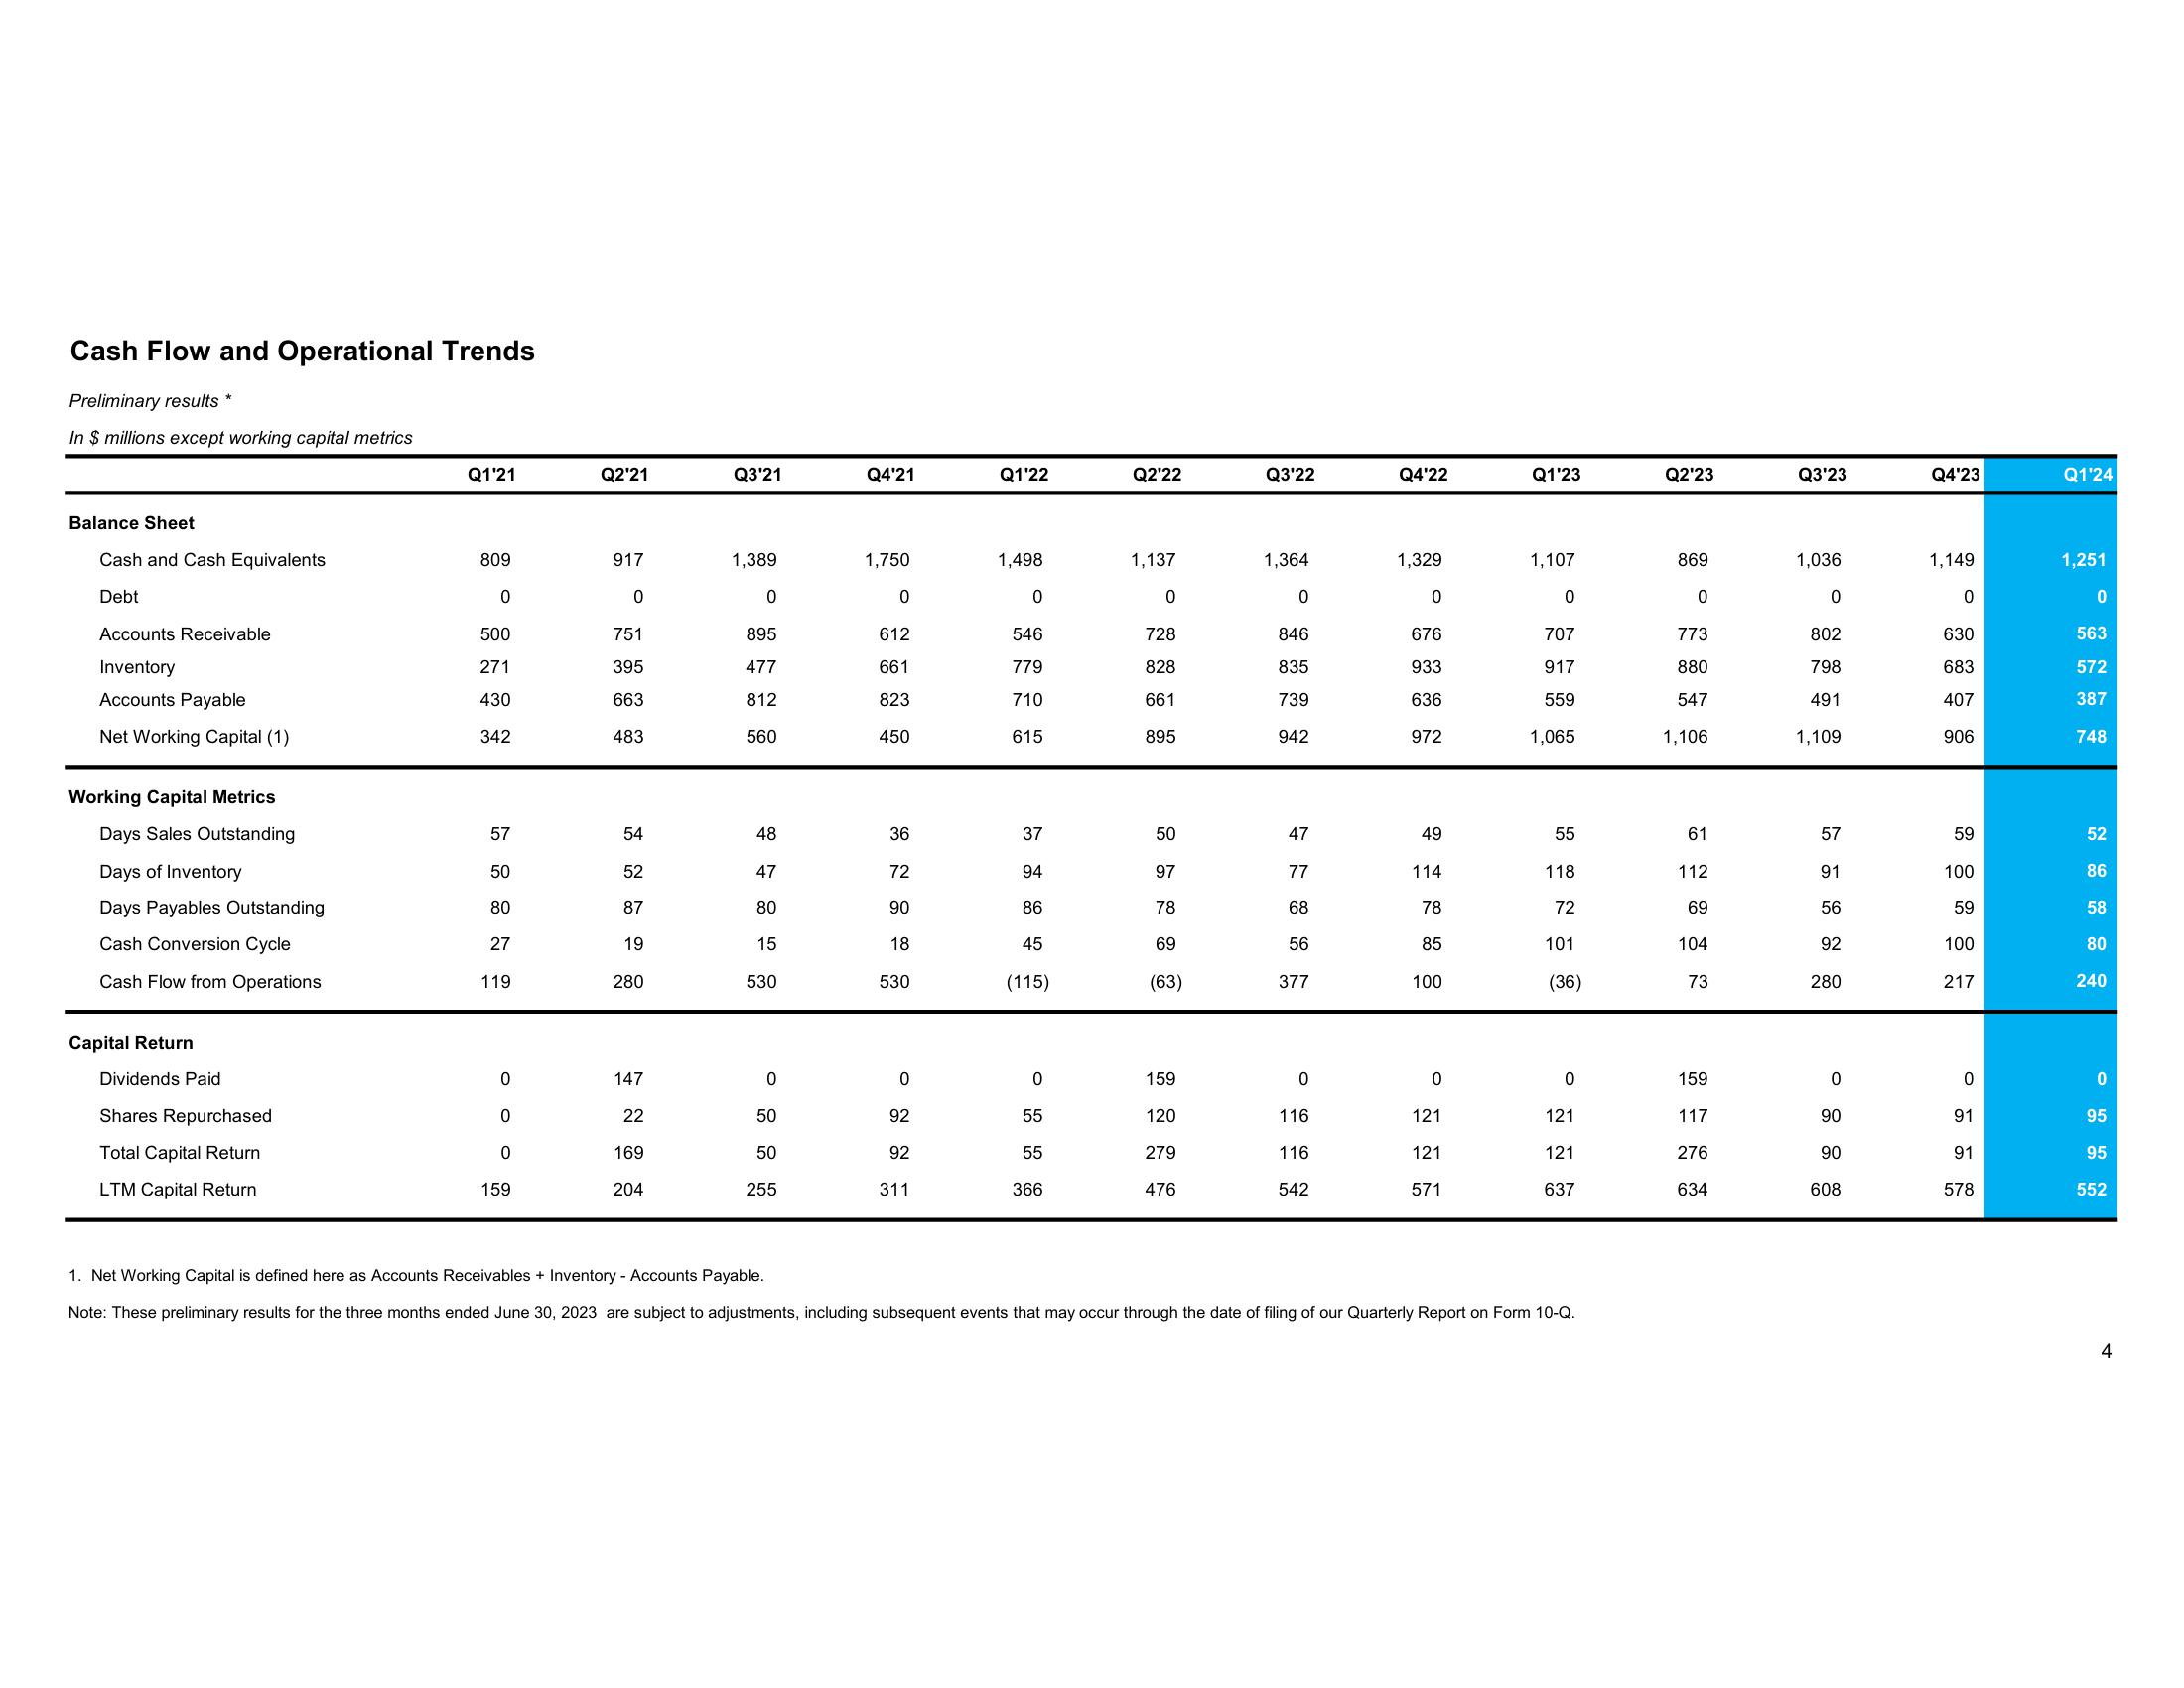
Cash Flow and Operational Trends
Preliminary results *
In $ millions except working capital metrics
Balance Sheet
Cash and Cash Equivalents
Debt
Accounts Receivable
Inventory
Accounts Payable
Net Working Capital (1)
Working Capital Metrics
Days Sales Outstanding
Days of Inventory
Days Payables Outstanding
Cash Conversion Cycle
Cash Flow from Operations
Capital Return
Dividends Paid
Shares Repurchased
Total Capital Return
LTM Capital Return
Q1'21
809
0
500
271
430
342
57
50
80
27
119
0
0
0
159
Q2'21
917
0
751
395
663
483
54
52
87
19
280
147
22
169
204
Q3'21
1,389
0
895
477
812
560
48
47
80
15
530
0
50
50
255
Q4'21
1,750
0
612
661
823
450
36
72
90
18
530
0
92
92
311
Q1'22
1,498
0
546
779
710
615
37
94
86
45
(115)
0
55
55
366
Q2'22
1,137
0
728
828
661
895
50
97
78
69
(63)
159
120
279
476
Q3'22
1,364
0
846
835
739
942
47
77
68
56
377
0
116
116
542
Q4'22
1,329
0
676
933
636
972
49
114
78
85
100
0
121
121
571
Q1'23
1,107
0
707
917
559
1,065
55
118
72
101
(36)
0
121
121
637
1. Net Working Capital is defined here as Accounts Receivables + ventory - Accounts Payable.
Note: These preliminary results for the three months ended June 30, 2023 are subject to adjustments, including subsequent events that may occur through the date of filing of our Quarterly Report on Form 10-Q.
Q2'23
869
0
773
880
547
1,106
61
112
69
104
73
159
117
276
634
Q3'23
1,036
0
802
798
491
1,109
57
91
56
92
280
0
90
90
608
Q4'23
1,149
0
630
683
407
906
59
100
59
100
217
0
91
91
578
Q1'24
1,251
0
563
572
387
748
52
86
58
80
240
0
95
95
552
4View entire presentation