Q2 Quarter 2023
Q2 23 Highlights
1
2
3
4
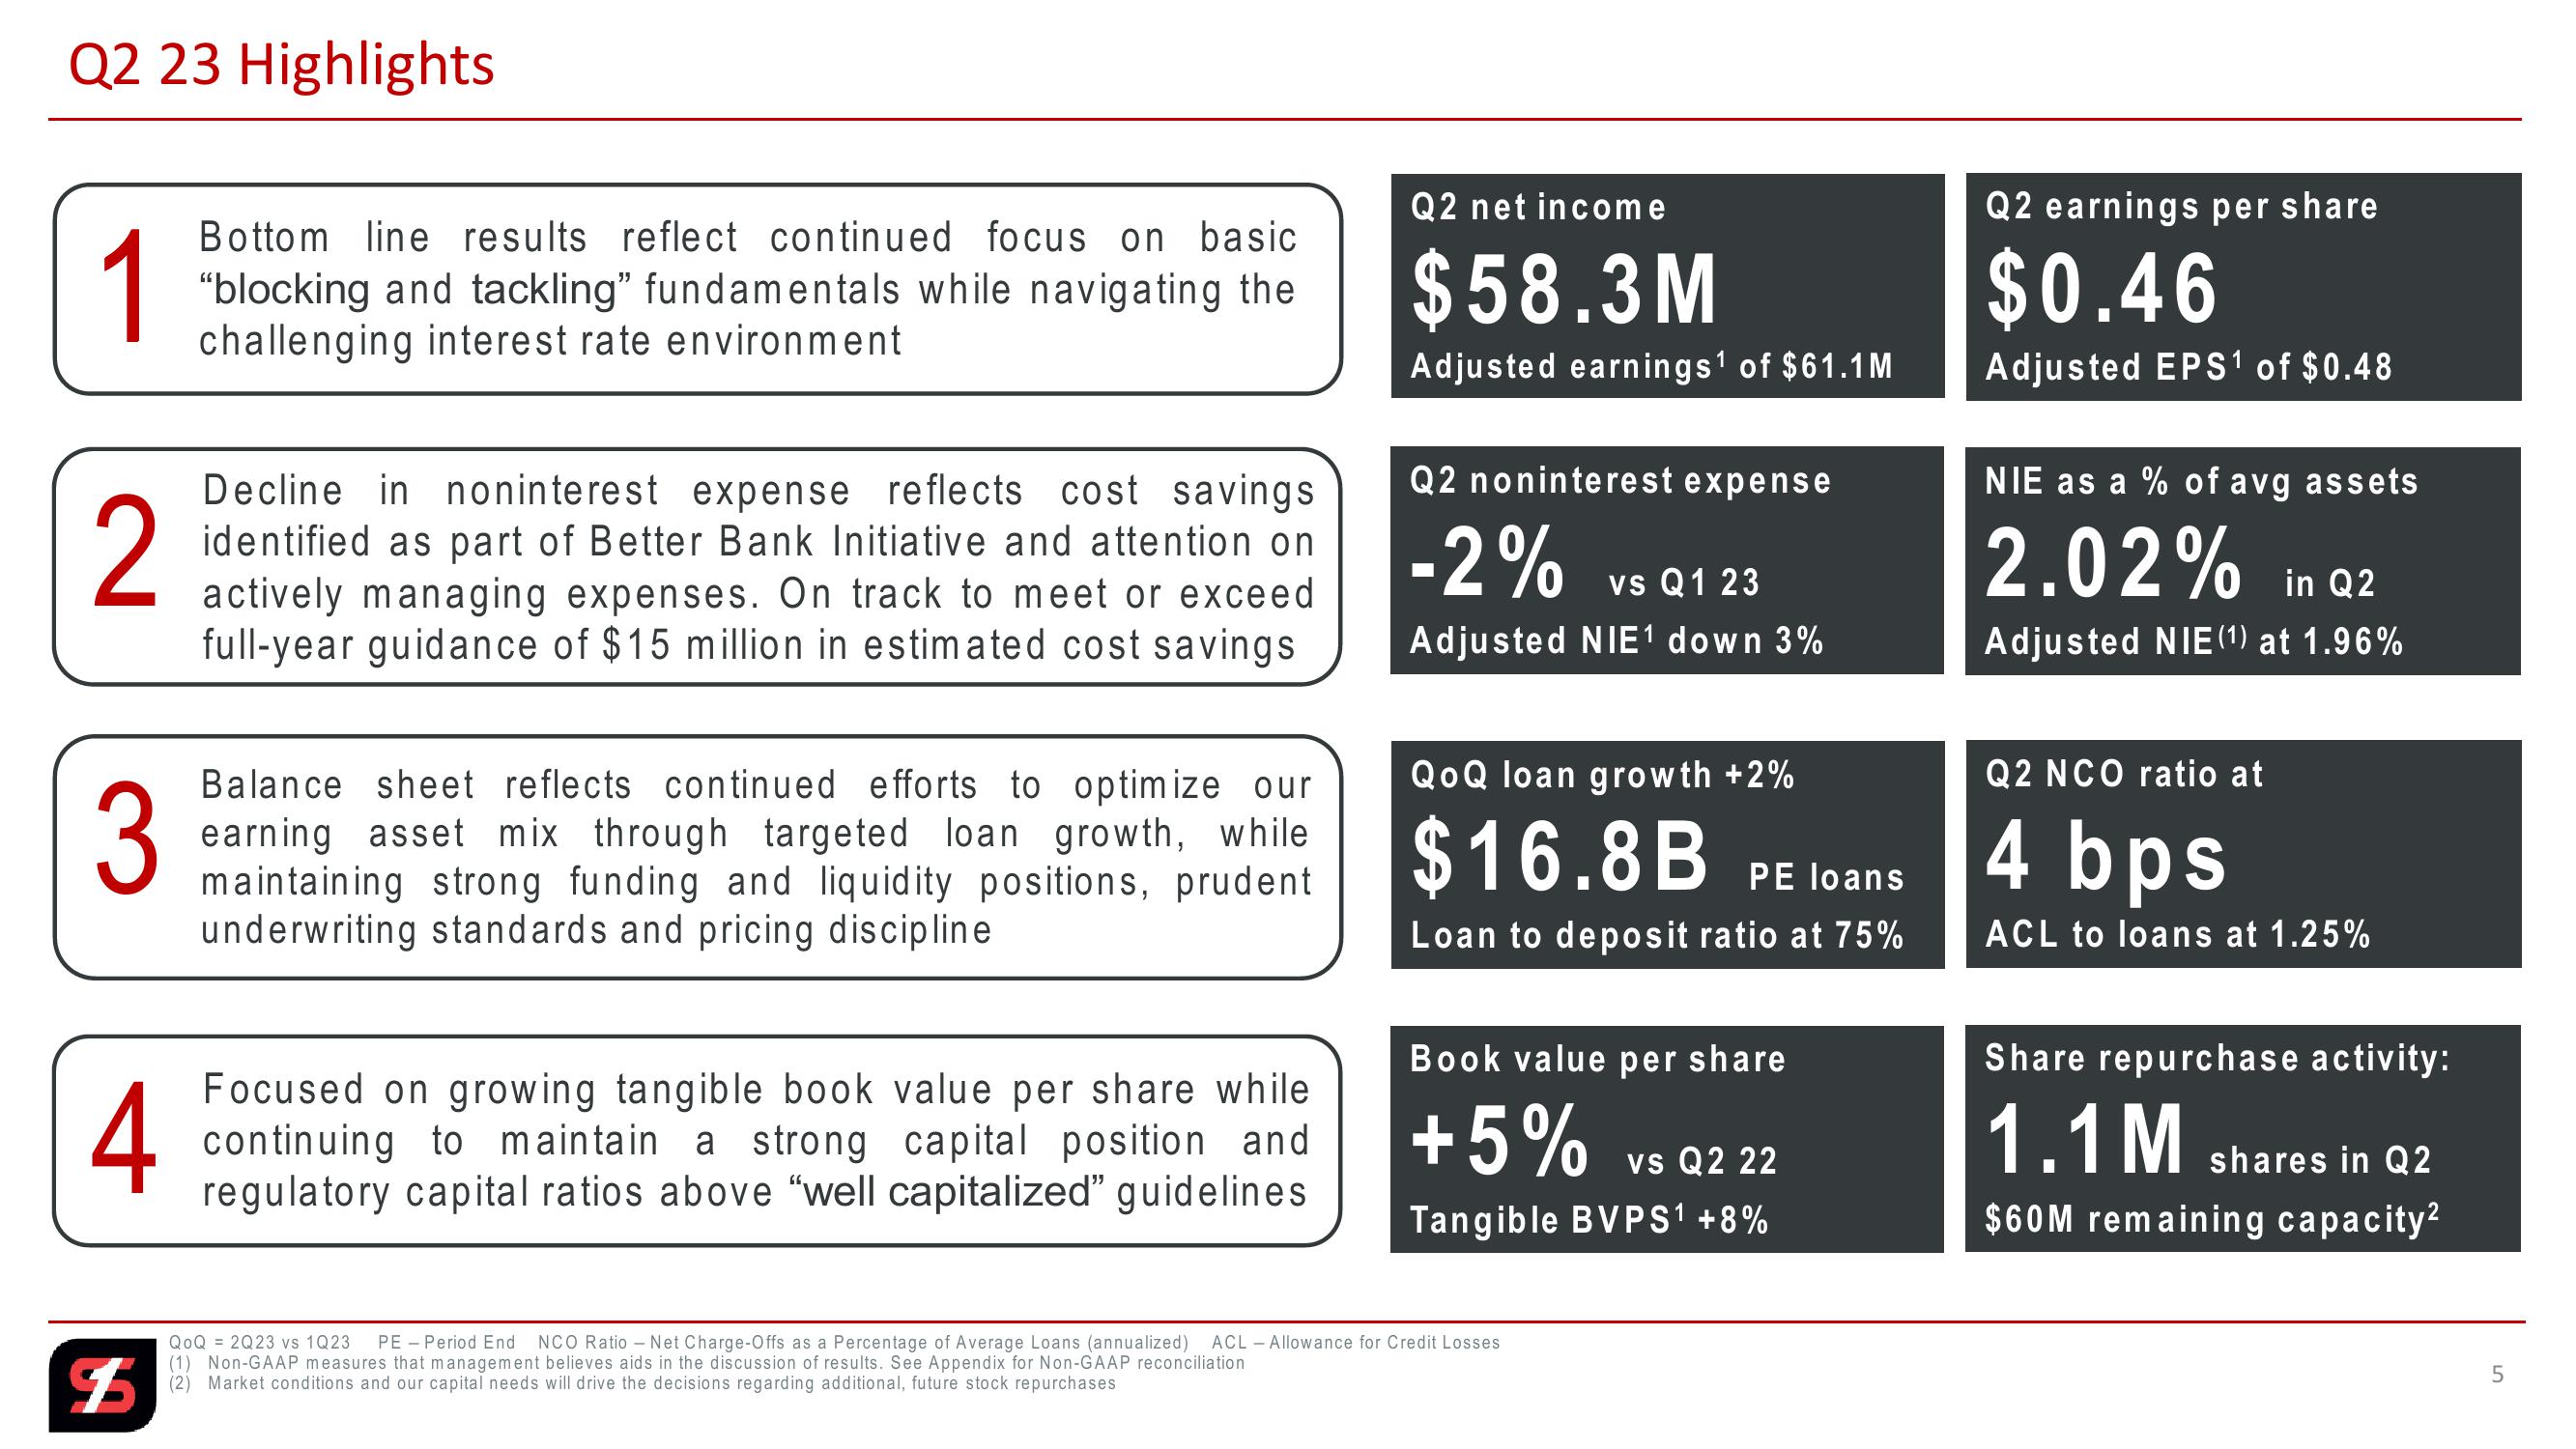
Bottom line results reflect continued focus on basic
"blocking and tackling" fundamentals while navigating the
challenging interest rate environment
Decline in noninterest expense reflects cost savings
identified as part of Better Bank Initiative and attention on
actively managing expenses. On track to meet or exceed
full-year guidance of $15 million in estimated cost savings
Balance sheet reflects continued efforts to optimize our
earning asset mix through targeted loan growth, while
maintaining strong funding and liquidity positions, prudent
underwriting standards and pricing discipline
Focused on growing tangible book value per share while
continuing to maintain a strong capital position and
regulatory capital ratios above "well capitalized" guidelines
Q2 net income
$58.3M
Adjusted earnings of $61.1M
Q2 noninterest expense
-2%
vs Q1 23
Adjusted NIE¹ down 3%
QoQ loan growth +2%
$16.8B
PE loans
Loan to deposit ratio at 75%
Book value per share
+5%
vs Q2 22
Tangible BVPS¹ +8%
Q2 earnings per share
$0.46
Adjusted EPS1 of $0.48
NIE as a % of avg assets
2.02% in Q2
Adjusted NIE (1) at 1.96%
Q2 NCO ratio at
4 bps
ACL to loans at 1.25%
Share repurchase activity:
1.1M
shares in Q2
$60M remaining capacity2
$
QoQ 2Q23 vs 1Q23 PE Period End NCO Ratio -Net Charge-Offs as a Percentage of Average Loans (annualized) ACL Allowance for Credit Losses
(1) Non-GAAP measures that management believes aids in the discussion of results. See Appendix for Non-GAAP reconciliation
(2) Market conditions and our capital needs will drive the decisions regarding additional, future stock repurchases
5View entire presentation