Bank of America Investment Banking Pitch Book
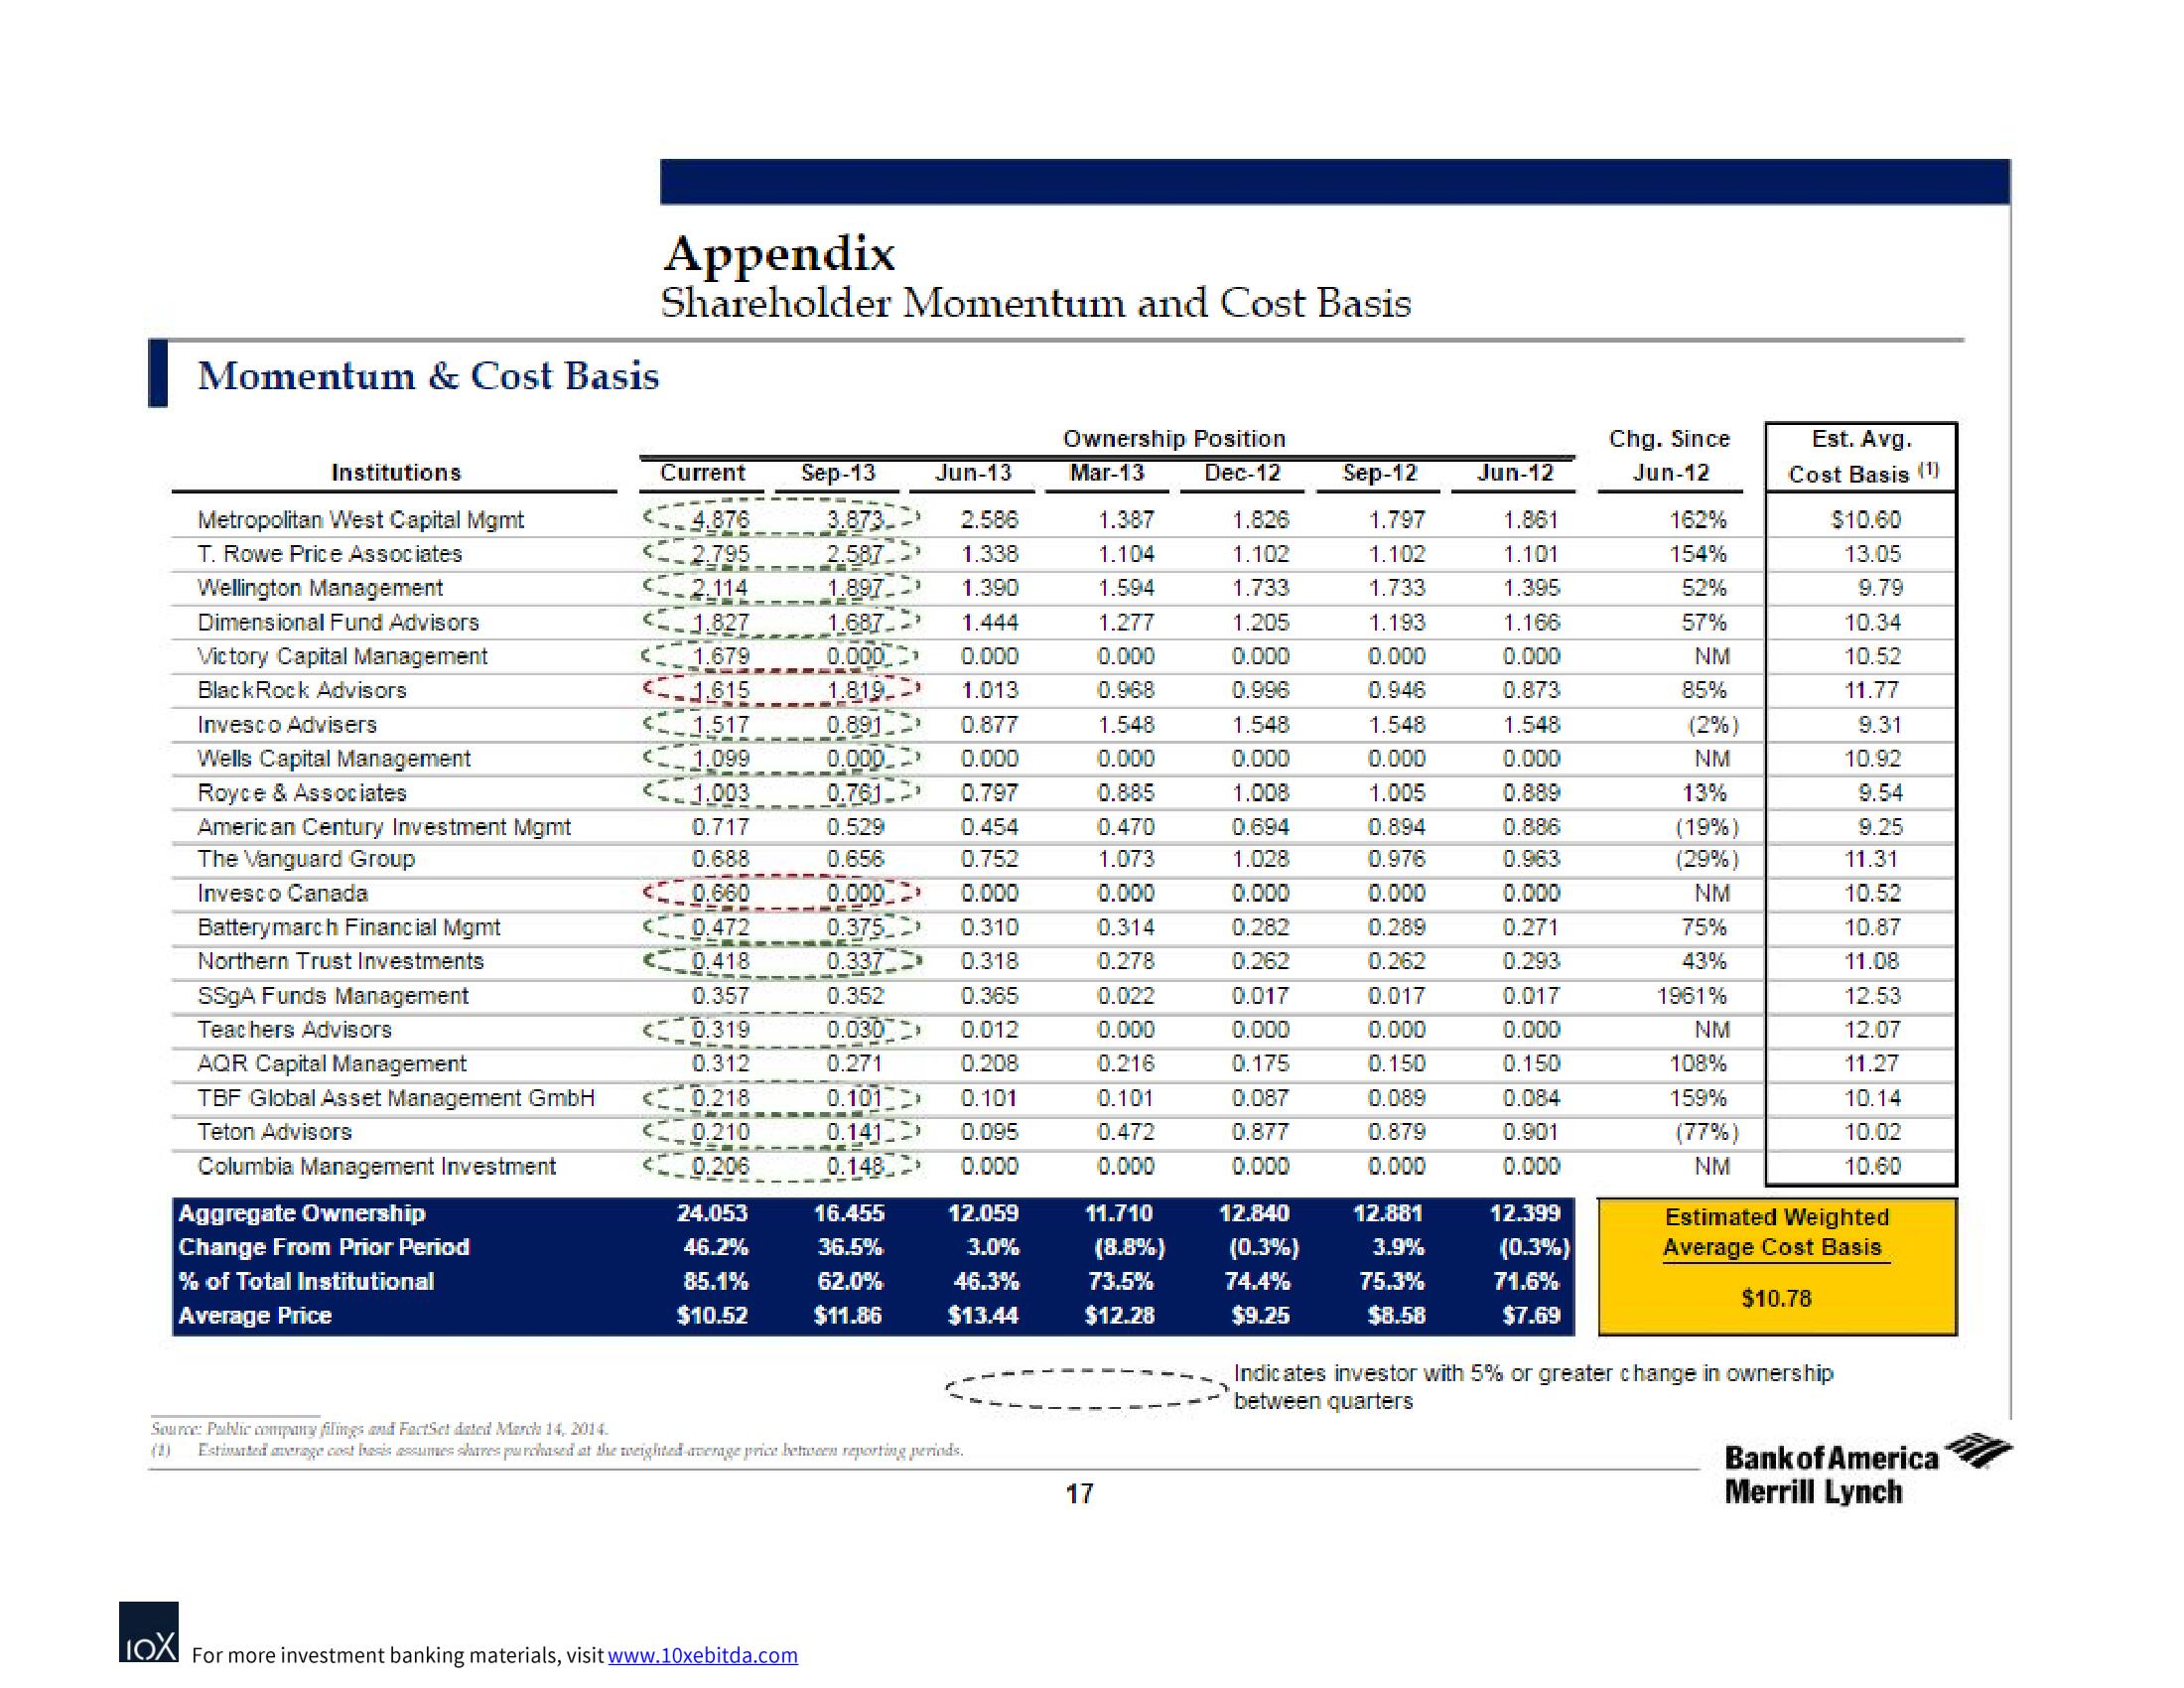
Momentum & Cost Basis
Institutions
Metropolitan West Capital Mgmt
T. Rowe Price Associates
Wellington Management
Dimensional Fund Advisors
Victory Capital Management
BlackRock Advisors
Invesco Advisers
Wells Capital Management
Royce & Associates
American Century Investment Mgmt
The Vanguard Group
Invesco Canada
Batterymarch Financial Mgmt
Northern Trust Investments
SSgA Funds Management
Teachers Advisors
AQR Capital Management
TBF Global Asset Management GmbH
Teton Advisors
Columbia Management Investment
Aggregate Ownership
Change From Prior Period
% of Total Institutional
Average Price
Appendix
Shareholder Momentum and Cost Basis
Current
<4.876
2.795
2.114
<1.827
< 1.679
<1.615
<1.517
< 1.099
<1.003
0.717
0.688
<0.660
<0.472
0.418
0.357
<0.319
0.312
<0.218
<0.210
24.053
46.2%
85.1%
$10.52
Sep-13
LOX For more investment banking materials, visit www.10xebitda.com
3.873-
2.587
1.897
1.687. 3
0.000
1.819
0.891
0.000
0.761-
0.529
0.656
Jun-13
2.586
1.338
1.390
1.444
0.000
1.013
0.877
0.000
0.797
0.454
0.752
0.000 3 0.000
0.375-
7 0.310
=
0.337
0.318
0.352
0.365
0.030
0.012
0.271
0.208
0.101
0.101
0.141
0.095
0.148
0.000
16.455
36.5%
62.0%
$11.86
12.059
3.0%
46.3%
$13.44
Source: Public company filings and FactSet dated March 14, 2014.
(1) Estimated average cost basis assumes shares purchased at the weighted average price between reporting periods.
Ownership Position
Mar-13
Dec-12
1.387
1.104
1.594
1.277
0.000
0.968
1.548
0.000
0.885
0.470
1.073
0.000
0.314
0.278
0.022
0.000
0.216
0.101
0.472
0.000
17
1.826
1.102
1.733
1.205
0.000
0.996
1.548
0.000
1.008
0.694
1.028
0.000
0.282
0.262
0.017
0.000
0.175
0.087
0.877
0.000
11.710
12.840
(8.8%) (0.3%)
73.5%
74.4%
$12.28
$9.25
Sep-12
1.797
1.102
1.733
1.193
0.000
0.946
1.548
0.000
1.005
0.894
0.976
0.000
0.289
0.262
0.017
0.000
0.150
0.089
0.879
0.000
12.881
3.9%
75.3%
$8.58
Jun-12
1.861
1.101
1.395
1.166
0.000
0.873
1.548
0.000
0.889
0.886
0.963
0.000
0.271
0.293
0.017
0.000
0.150
0.084
0.901
0.000
12.399
(0.3%)
71.6%
$7.69
Chg. Since
Jun-12
162%
154%
52%
57%
NM
85%
(2%)
NM
13%
(19%)
(29%)
NM
75%
43%
1961%
NM
108%
159%
(77%)
NM
Est. Avg.
Cost Basis (1)
$10.60
13.05
9.79
10.34
10.52
11.77
9.31
10.92
9.54
9.25
11.31
10.5.2
10.87
11.08
12.53
12.07
11.27
10.14
10.02
10.60
Estimated Weighted
Average Cost Basis
$10.78
Indicates investor with 5% or greater change in ownership
between quarters
Bank of America
Merrill LynchView entire presentation