Ashtead Group Results Presentation Deck
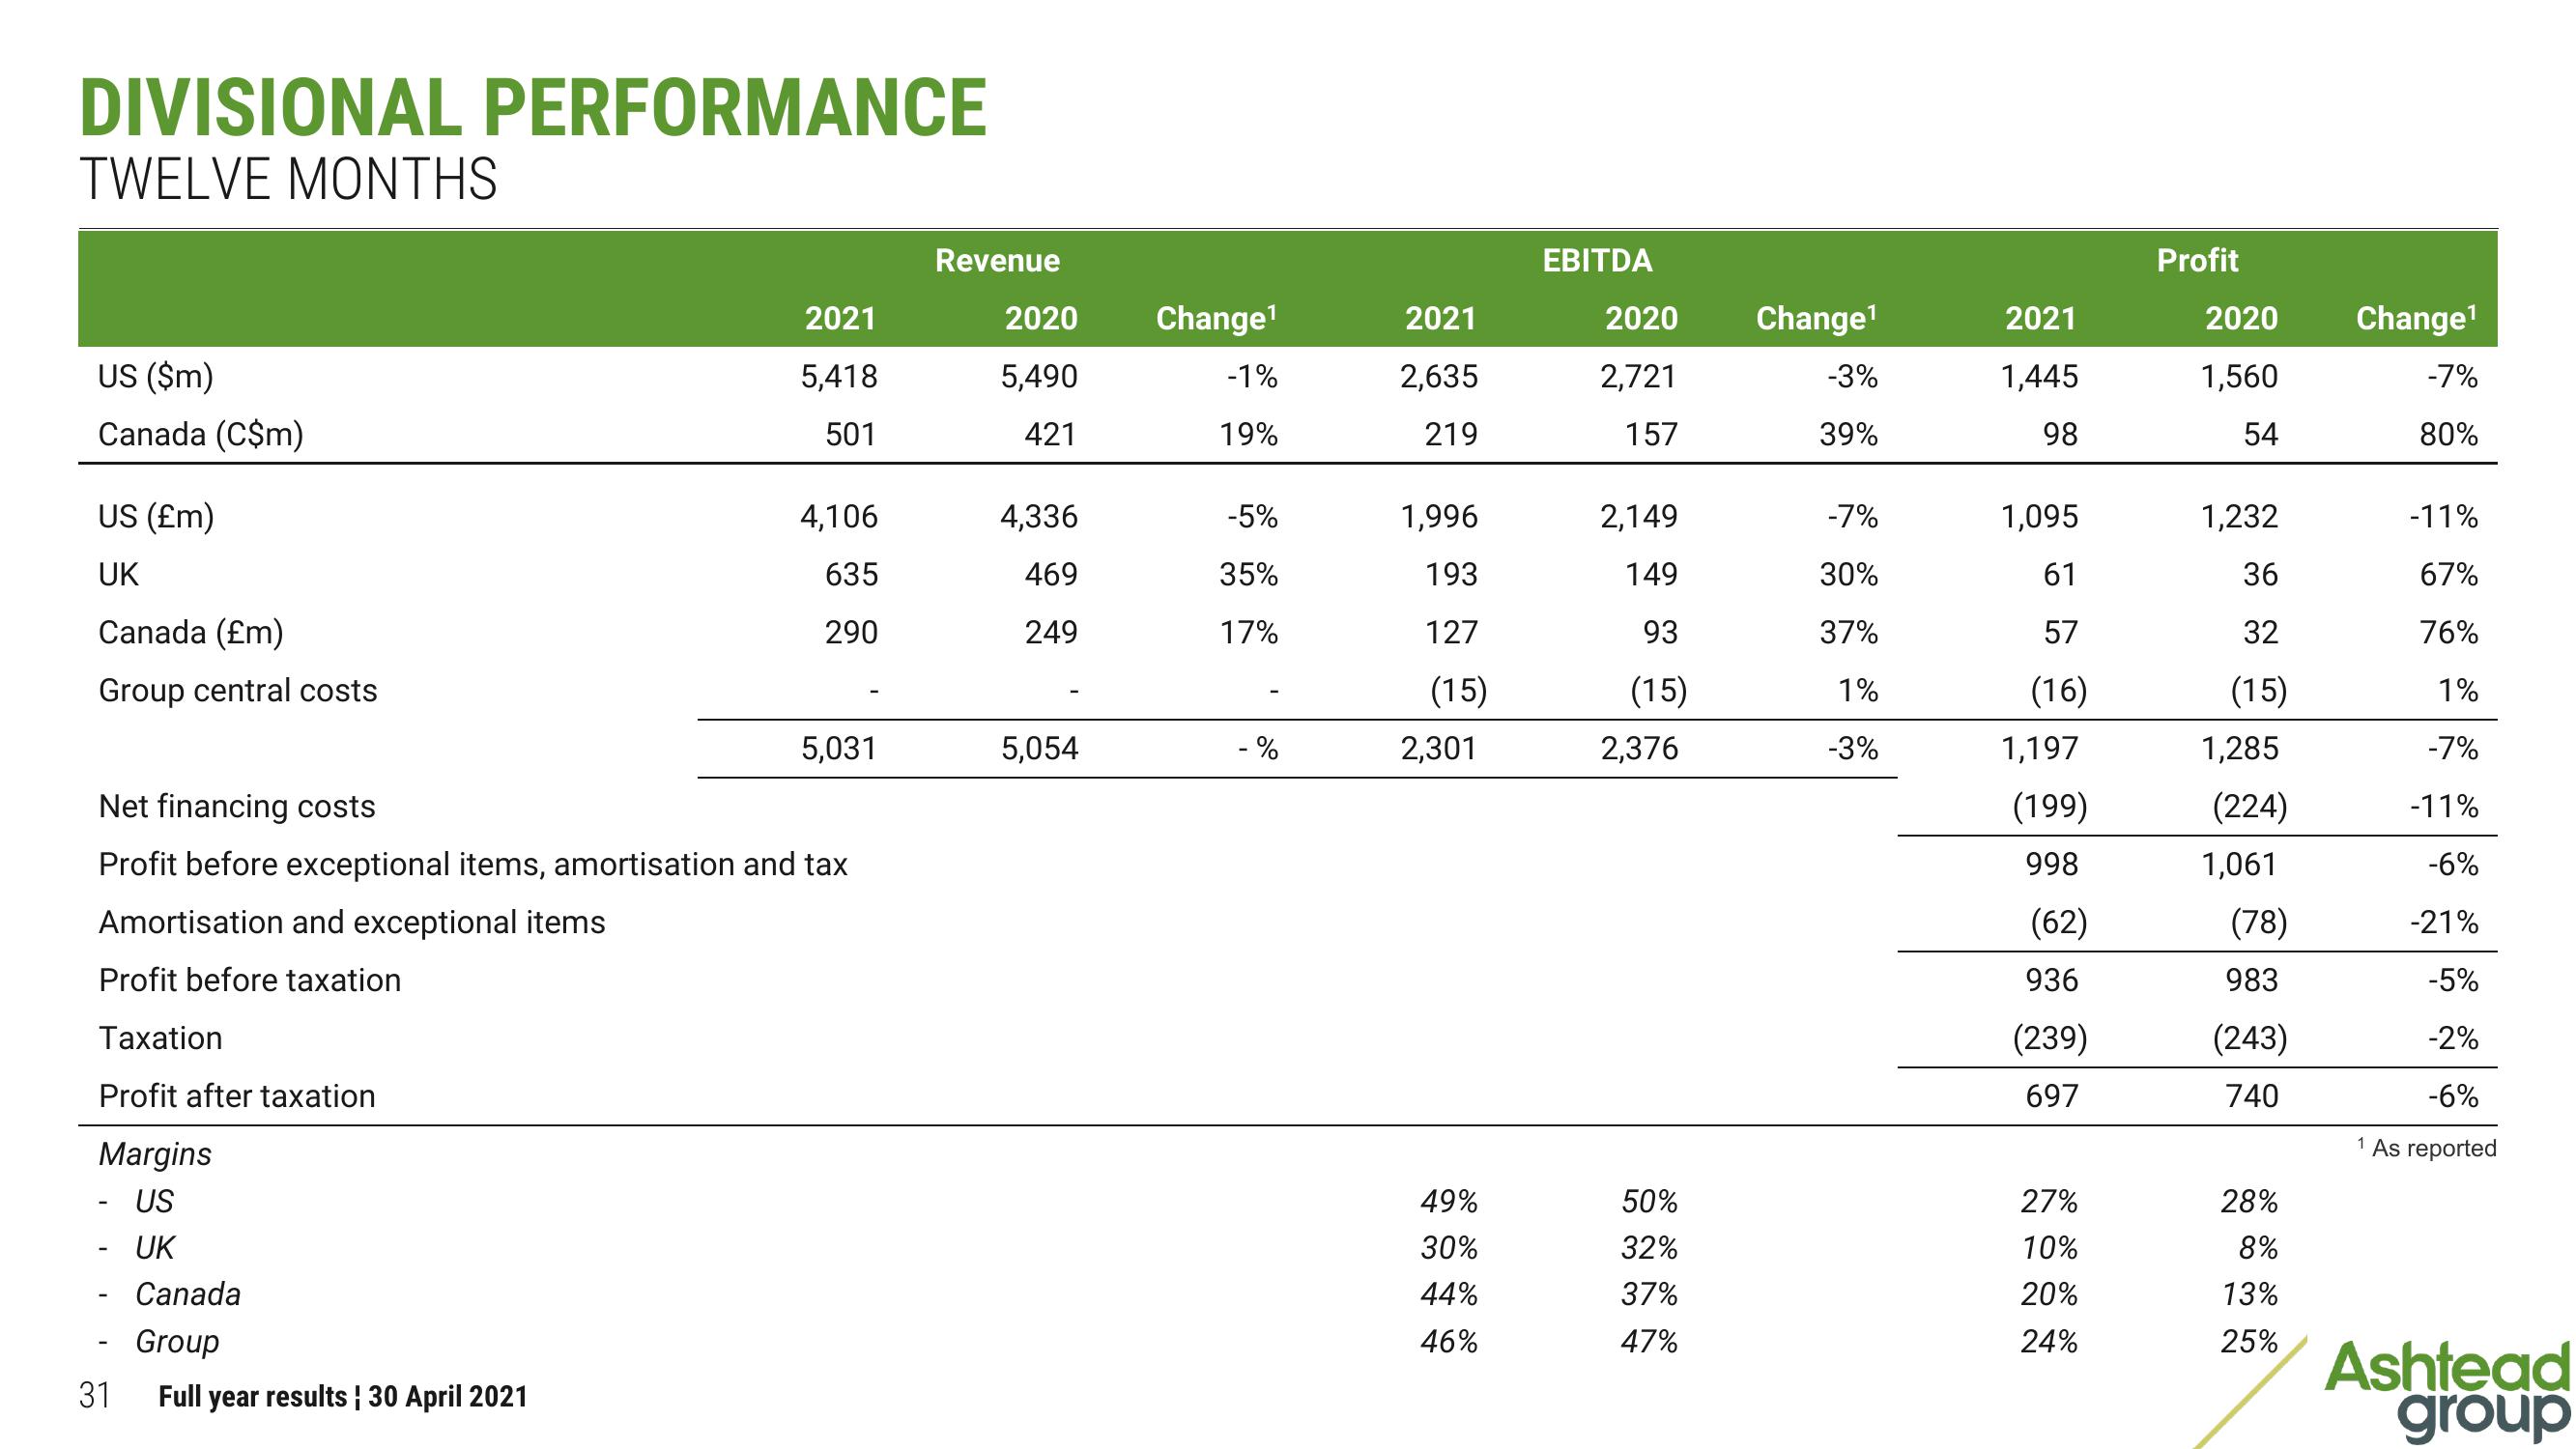
DIVISIONAL PERFORMANCE
TWELVE MONTHS
US ($m)
Canada (C$m)
US (£m)
UK
Canada (£m)
Group central costs
Amortisation and exceptional items
Profit before taxation
Taxation
Profit after taxation
Margins
- US
UK
31
2021
5,418
501
Net financing costs
Profit before exceptional items, amortisation and tax
Canada
Group
Full year results ¦ 30 April 2021
4,106
635
290
5,031
Revenue
2020
5,490
421
4,336
469
249
5,054
Change¹
-1%
19%
-5%
35%
17%
- %
2021
2,635
219
1,996
193
127
(15)
2,301
49%
30%
44%
46%
EBITDA
2020
2,721
157
2,149
149
93
(15)
2,376
50%
32%
37%
47%
Change¹
-3%
39%
-7%
30%
37%
1%
-3%
2021
1,445
98
1,095
61
57
(16)
1,197
(199)
998
(62)
936
(239)
697
27%
10%
20%
24%
Profit
2020
1,560
54
1,232
36
32
(15)
1,285
(224)
1,061
(78)
983
(243)
740
Change¹
-7%
80%
-11%
67%
76%
1%
-7%
-11%
-6%
-21%
-5%
-2%
-6%
1 As reported
28%
8%
13%
25% Ashtead
groupView entire presentation