Granite Ridge Investor Presentation Deck
●
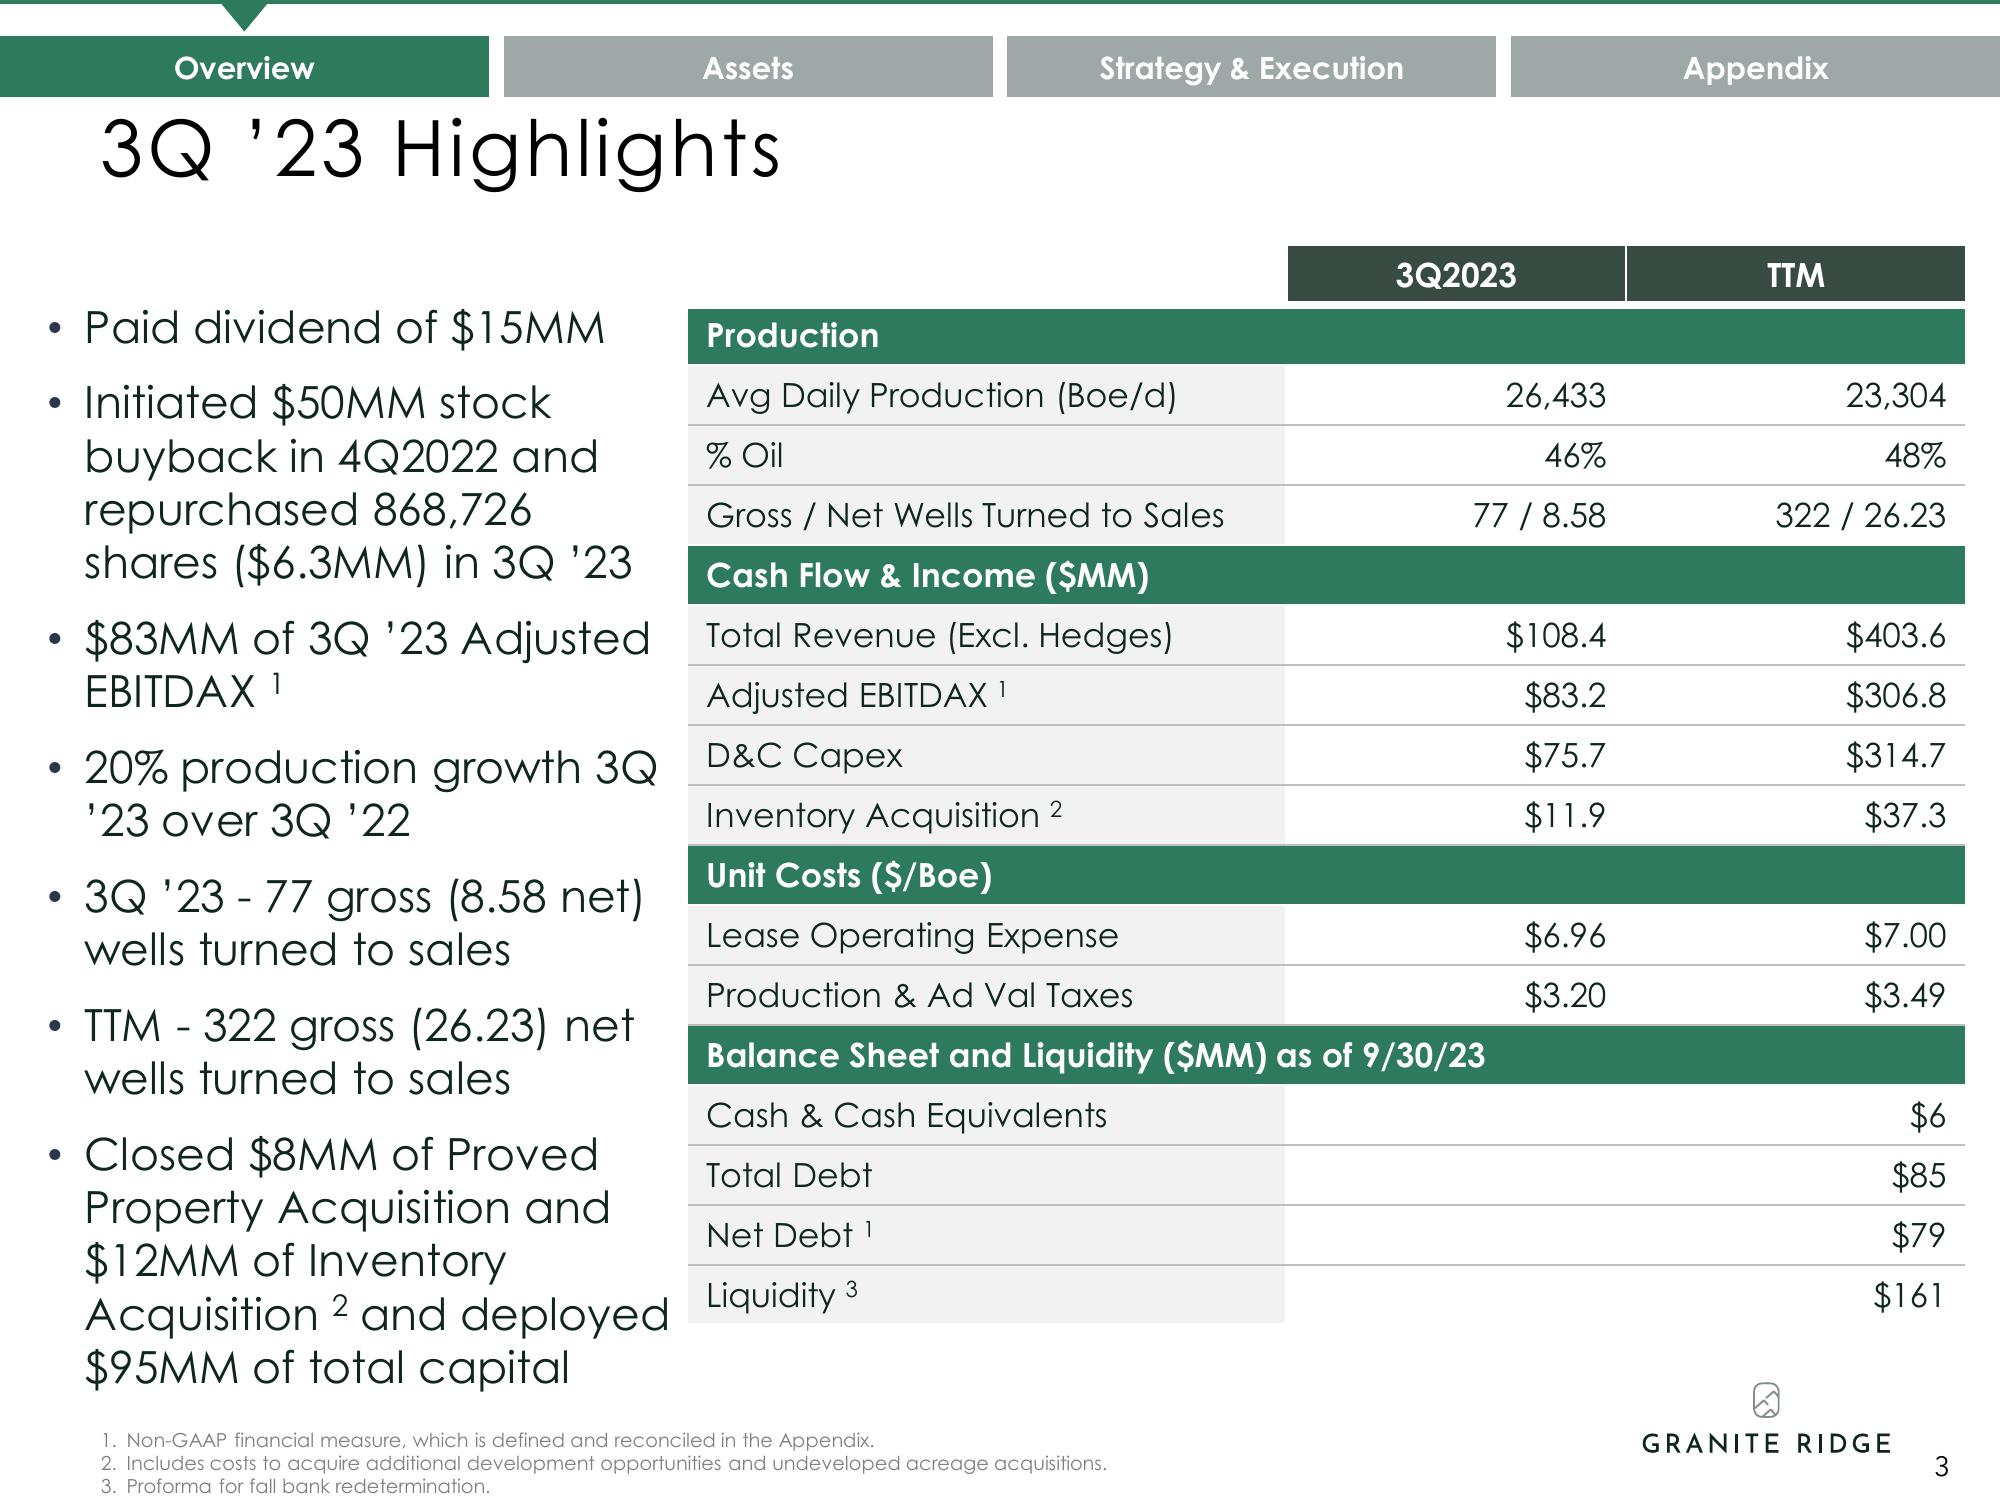
• Paid dividend of $15MM
Initiated $50MM stock
buyback in 4Q2022 and
repurchased 868,726
shares ($6.3MM) in 3Q '23
●
●
●
Overview
●
3Q '23 Highlights
$83MM of 3Q '23 Adjusted
EBITDAX ¹
20% production growth 3Q
'23 over 3Q '22
3Q '23 - 77 gross (8.58 net)
wells turned to sales
• TTM - 322 gross (26.23) net
wells turned to sales
Assets
Closed $8MM of Proved
Property Acquisition and
$12MM of Inventory
Acquisition 2 and deployed
$95MM of total capital
Strategy & Execution
Production
Avg Daily Production (Boe/d)
% Oil
Gross / Net Wells Turned to Sales
Cash Flow & Income ($MM)
Total Revenue (Excl. Hedges)
Adjusted EBITDAX ¹
D&C Capex
3Q2023
1. Non-GAAP financial measure, which is defined and reconciled in the Appendix.
2. Includes costs to acquire additional development opportunities and undeveloped acreage acquisitions.
3. Proforma for fall bank redetermination.
26,433
46%
77 / 8.58
Inventory Acquisition 2
Unit Costs ($/Boe)
Lease Operating Expense
Production & Ad Val Taxes
Balance Sheet and Liquidity ($MM) as of 9/30/23
Cash & Cash Equivalents
Total Debt
Net Debt ¹
Liquidity 3
$108.4
$83.2
$75.7
$11.9
$6.96
$3.20
Appendix
TTM
23,304
48%
322 / 26.23
$403.6
$306.8
$314.7
$37.3
$7.00
$3.49
$6
$85
$79
$161
GRANITE RIDGE
3View entire presentation