Toyota Investor Presentation Deck
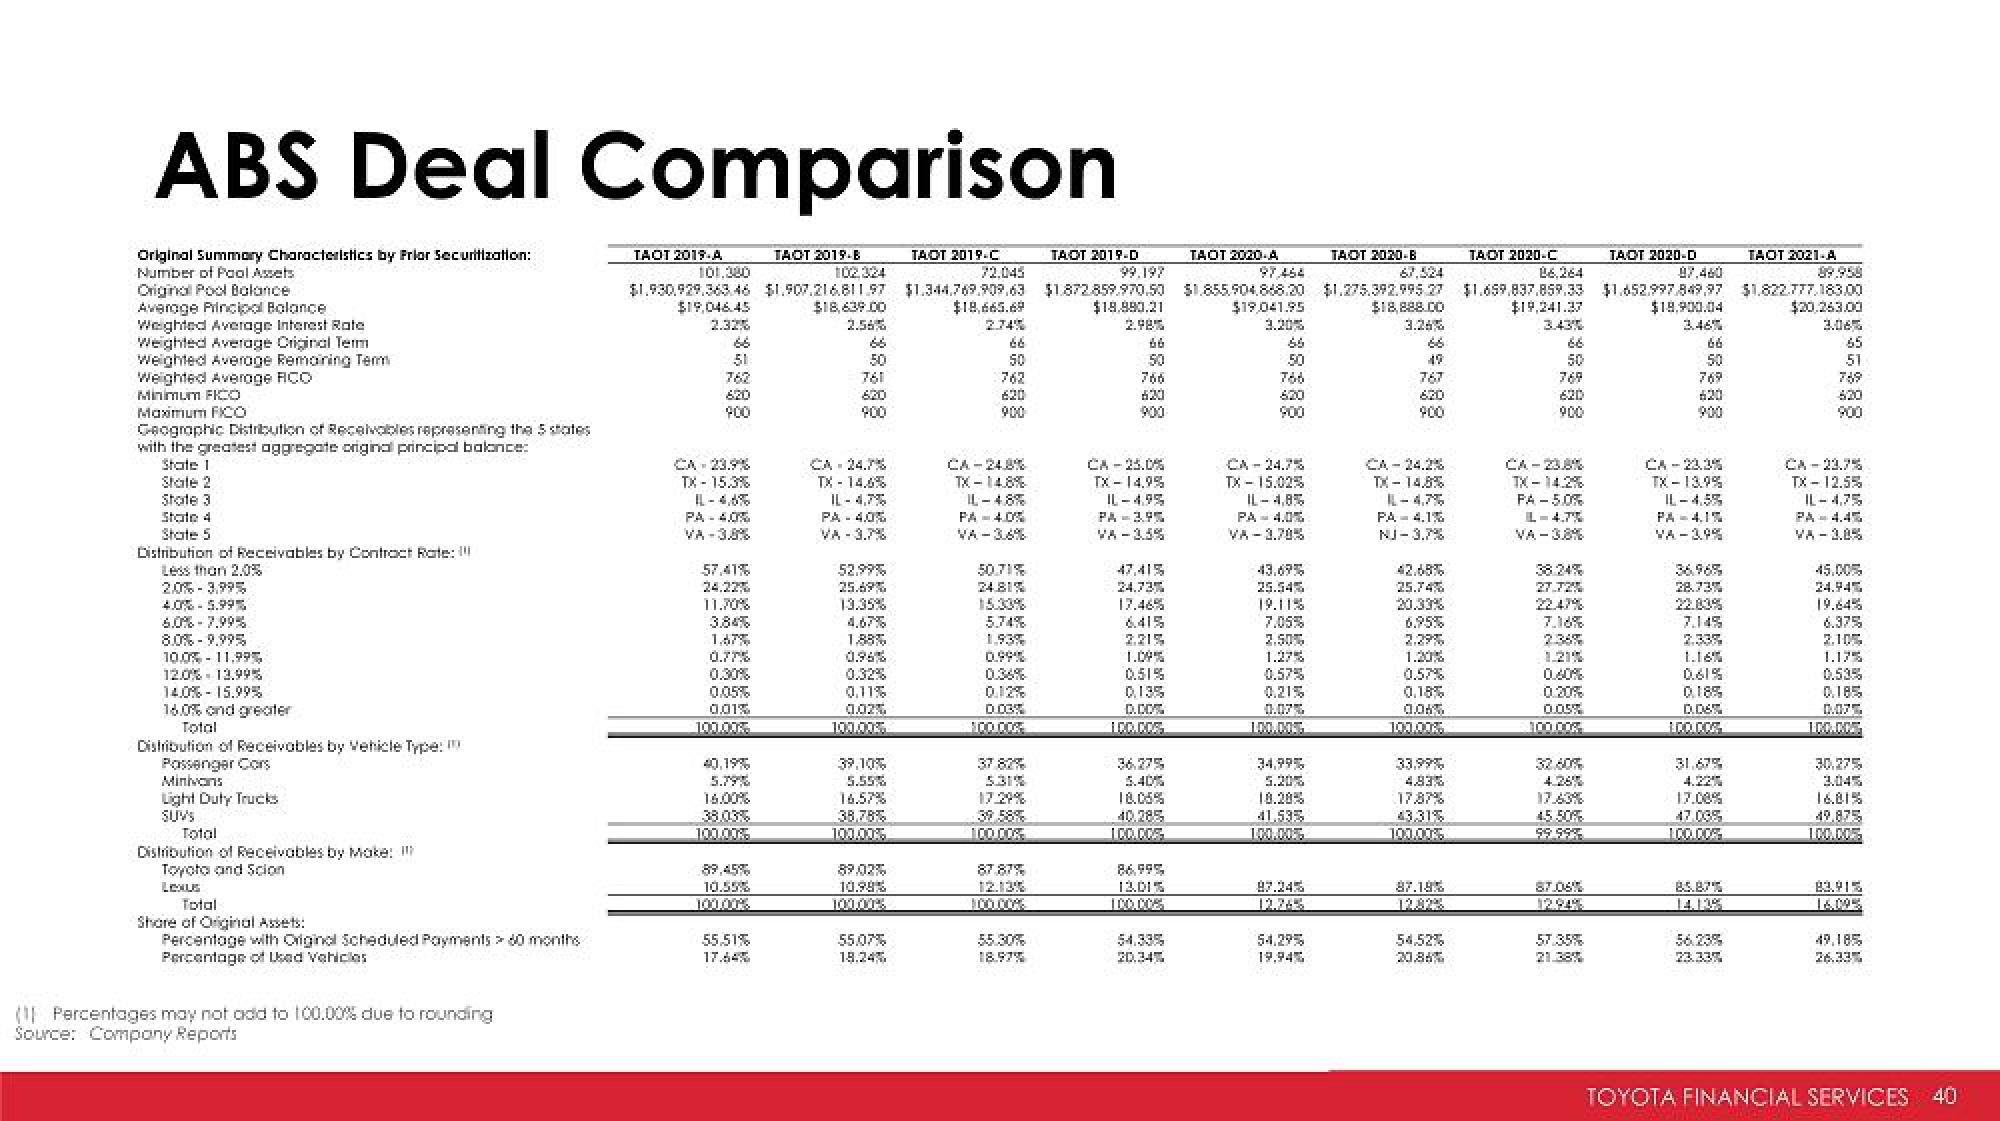
ABS Deal Comparison
TAOT 2019-B
102,324
Original Summary Characteristics by Prior Securitization:
Number of Pool Assets
Original Pool Balance.
Average Principal Balance
Weighted Average Interest Rate
Weighted Average Original Term
Weighted Average Remaining Term
Weighted Average RCC
Minimum FICO
Maximum FICO
Geographic Distribution of Receivables representing the 5 states
with the greatest aggregate original principal balance:
State 1
State 2
State 3
State 4
State 5
Distribution of Receivables by Contract Rate:
Less than 2.0%
20% 3.995
4.0%-5.99%
6.0%-7.995
8.0%-9.99%
10.0% 11,99%
12.0% 13.995
14.0%-15.99%
16.0% and greater
Total
Distribution of Receivables by Vehicle Type:
Passenger Cors
Minivans
Light Duty Trucks
Total
Distribution of Receivables by Make:
Toyoto and Scion
Lexus
Total
Share of Original Assets:
Percentage with Original Scheduled Payments 60 months
Percentage of Used Vehicles
(Percentages may not add to 100.00% due to rounding
Source: Company Reports
TAOT 2019-A
101.380
$1.930,929.363.46 $1,907,216811.97
$19,046.45
$18,639.00
2.32%
2.56%5
66
51
762
620
900
CA 23.9%
TX - 15.3%
IL-4,6%
PA 4.0%
57,41%
24.22%
11.70%
147%
0.775
0.30%
0.05%
0.01%
100.00%
5.79%
16.00%
38.036
100.00%
10.55%
100.00%
55.51%
17.64%
50
761
900
CA 24.7%
TX - 14.6%
IL-4,7%
PA 4.0%
VA 3.7%
52.99%
25.69%
13.35%
0.11%
0.02%
100.00%
39.10%
5.55%
16.57%
38.78%
100.00%
89.02%
10.99%
100.00%
55.07%
18.24%
TAOT 2019-C
72,045
$1.344.769.909.63 $1.872.859.970.50
$18,665.69
$18.990.21
2.74%
2.98%
66
66
50
50
762
766
620
620
900
CA-24.8%
TX-14.8%
IL-48%
PA 4.0%
50.71%
24.81%
15.33%
1.93%
0.99%
0.03%
100.000
37 82%
5.31%
17.29%
39 58%
100.00%
87.87%
12.13%
100.000
TAOT 2019-D
55.30%
18.97%
CA-25.0%
TX- 14.9%
IL-4.9%
PA 3.95
VA-3.5%
47.41%
24.735
17.46%
2.21%
1.09%
0.51%
0.13%
D.CO%
100.00%
36.27%
5.40%
18.05%
40.285
100.00%
86,995
12.015
54,335
20.34
TAOT 2020-A
97,464
$1.855.904.868.20
$19,041.95
66
50
766
620
TX - 15.025
IL-4,8%
PA - 4.05
VA 3.70%
25.545
19.11%
7.05%
2.50%
1.27%
0.57%
0.21%
0.07%
100.00%
34,995
5.20%
18.28%
41.535
12.745
54.29%
TAOT 2020-B
67,524
$1.275.392.995 27
$18,888.00
3.26%
68
49
767
620
900
TX-14.8%
PA 4.1%
NJ-3.7%
25.74%
20.33%
2.29%
1.20%
0.57%
0.18%
0.06%
100.00%
33,99%
4.83%
17.87%
43.31%
100.00%
87.18%
54,52%
20.86%
TAOT 2020-C
B6,264
$1.659.837.859.33 $1.652.997.849.97
$19,241.37
3.43%
66
50
769
620
900
CA-23.8%
TX-14.2%
FA-50%
L-4.75
VA-38%
38.24%
27.72%
22.47%
7.18%
1.21%
0.20%
0.05%
100.00%
32.40%
4.26%
17.63%
45.50%
99.998
TAOT 2020-D
87.460
87.06%
12.94%
57.35%
$18.900.04
3.46%
66
50
769
620
900
CA-23.35
TX-13.9%
IL-4.5%
PA 4.1%
VA-3.9%
28.73%
1.16%
0.61%
0.18%
0.06%
100.00%
31.67%
17.00%
47.08%
100.00%
85.87%
14.13%
56.23%
23.33%
TAOT 2021-A
89.958
$1.822.777,183.00
$20.263.00
3.06
51
769
620
900
CA 23.7%
TX-12.5%
IL-4.75
PA 4.45
VA-3.8%
45.00%
24.945
19.64%
6.37%
2.105
1.17%
0.52%
0.185
0.075
100.00%
30.275
3.04%
16.81%
49.875
100.00%
83.915
16.095
49.185
26.33
TOYOTA FINANCIAL SERVICES 40View entire presentation