Markforged SPAC Presentation Deck
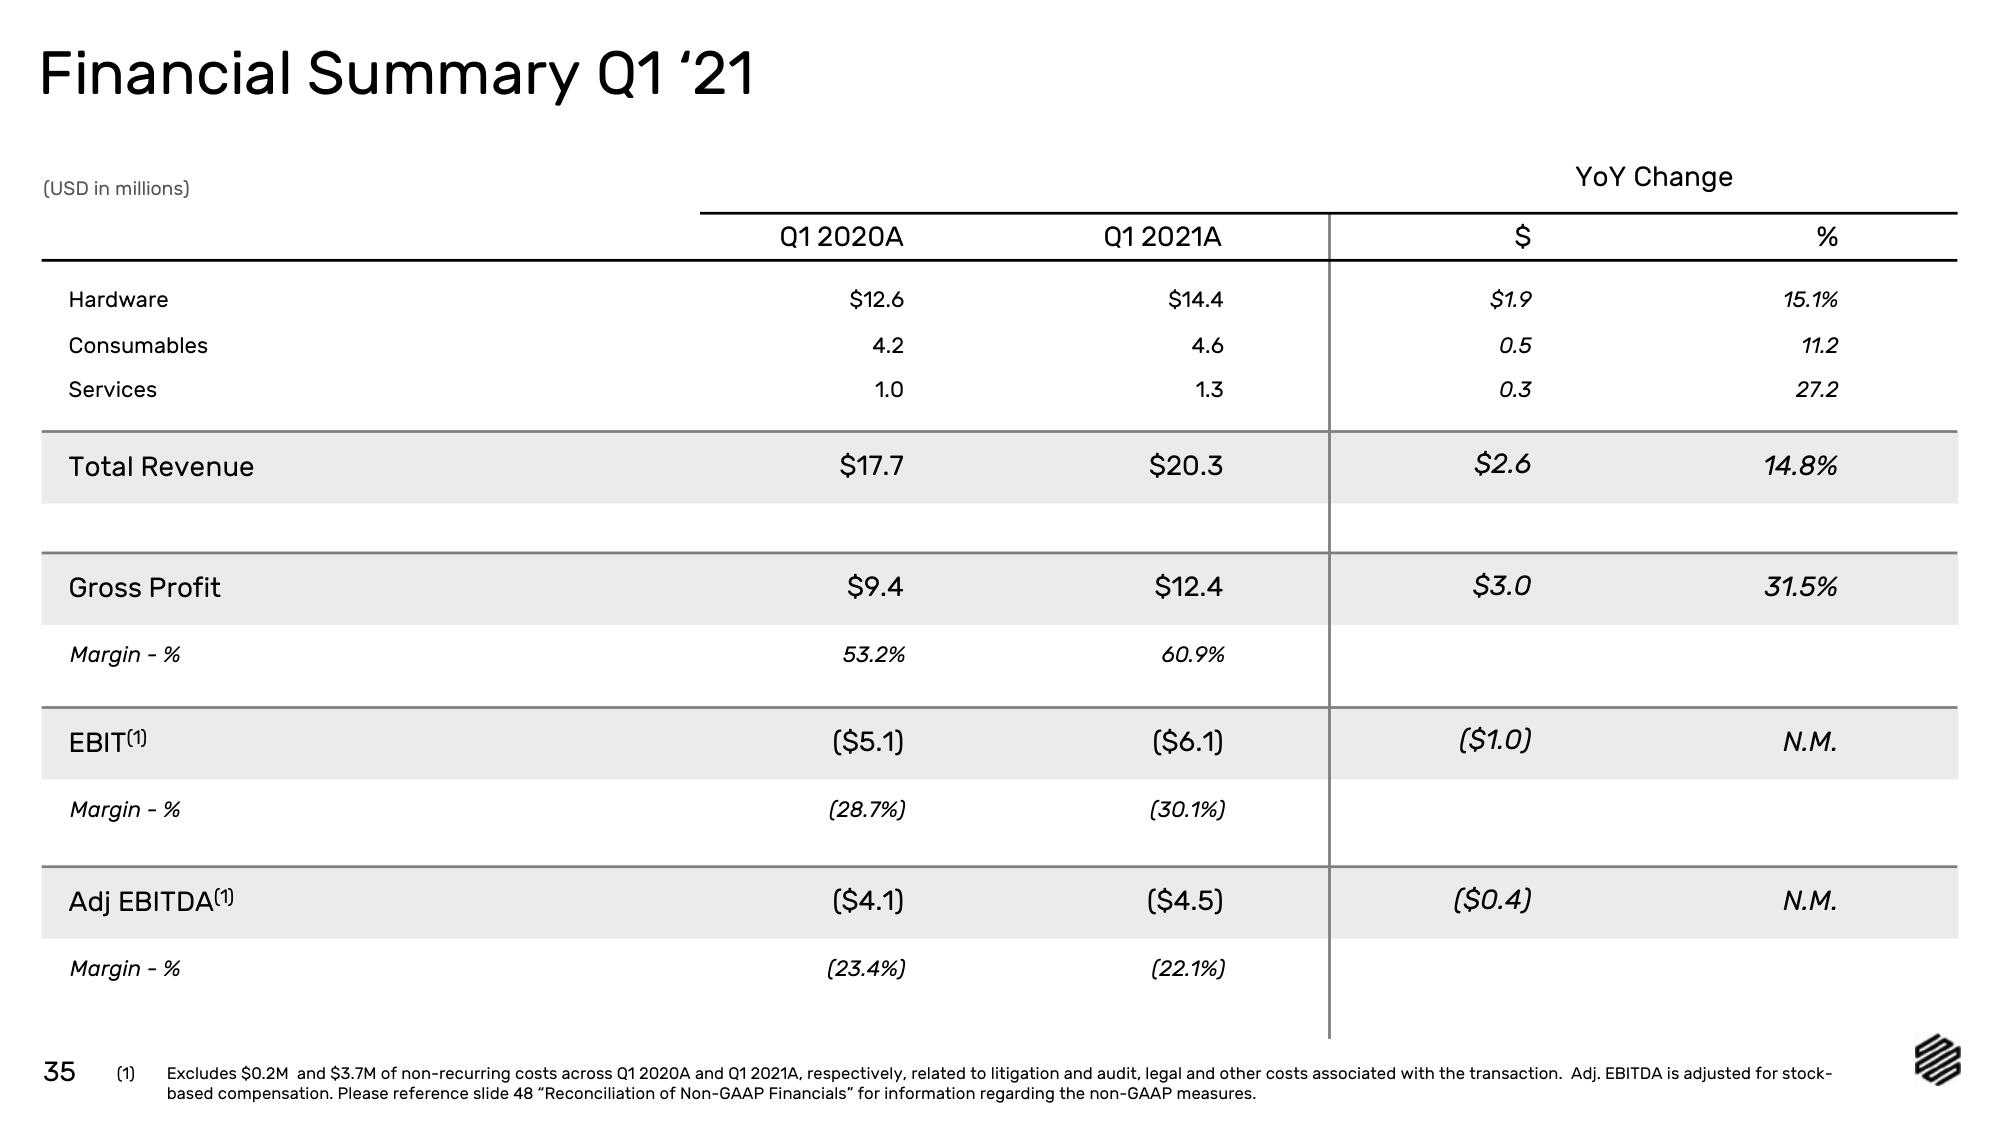
Financial Summary Q1 '21
(USD in millions)
Hardware
Consumables
Services
Total Revenue
Gross Profit
Margin - %
EBIT(1)
Margin - %
Adj EBITDA(1)
Margin - %
35
(1)
Q1 2020A
$12.6
4.2
1.0
$17.7
$9.4
53.2%
($5.1)
(28.7%)
($4.1)
(23.4%)
Q1 2021A
$14.4
4.6
1.3
$20.3
$12.4
60.9%
($6.1)
(30.1%)
($4.5)
(22.1%)
$
$1.9
0.5
0.3
$2.6
$3.0
($1.0)
($0.4)
YOY Change
%
15.1%
11.2
27.2
14.8%
31.5%
N.M.
N.M.
Excludes $0.2M and $3.7M of non-recurring costs across Q1 2020A and Q1 2021A, respectively, related to litigation and audit, legal and other costs associated with the transaction. Adj. EBITDA is adjusted for stock-
based compensation. Please reference slide 48 "Reconciliation of Non-GAAP Financials" for information regarding the non-GAAP measures.View entire presentation