Pathward Financial Results Presentation Deck
STRONG REVENUE GROWTH AND DISCIPLINED
EXPENSE MANAGEMENT DRIVE PROFITABILITY
FIRST QUARTER ENDED DECEMBER 31, 2020
4
●
●
INCOME STATEMENT
($ in thousands, except per share data)
Net interest income
Provision for loan and lease losses
Payments card & deposit fees
Total noninterest income
Total noninterest expense
Net income before taxes
Income tax expense
Net income before non-controlling interest
Net income attributable to non-controlling interest
Net income attributable to parent
Earnings per share, diluted
Average diluted shares
$
$
1021
65,999
6,089
22,564
45,455
72,575
32,790
3,533
29,257
1,220
28,037
0.84
32,790,895
$
$
4Q20
64,513
8,980
21,422
40,750
80,283
16,000
1,791
14,209
1,051
13,158 $
0.38 $
33,783,659
1Q20
64,651
3,407
21,499
37,483
75,798
22,929
680
22,249
1,181
21,068
0.56
36,647,789
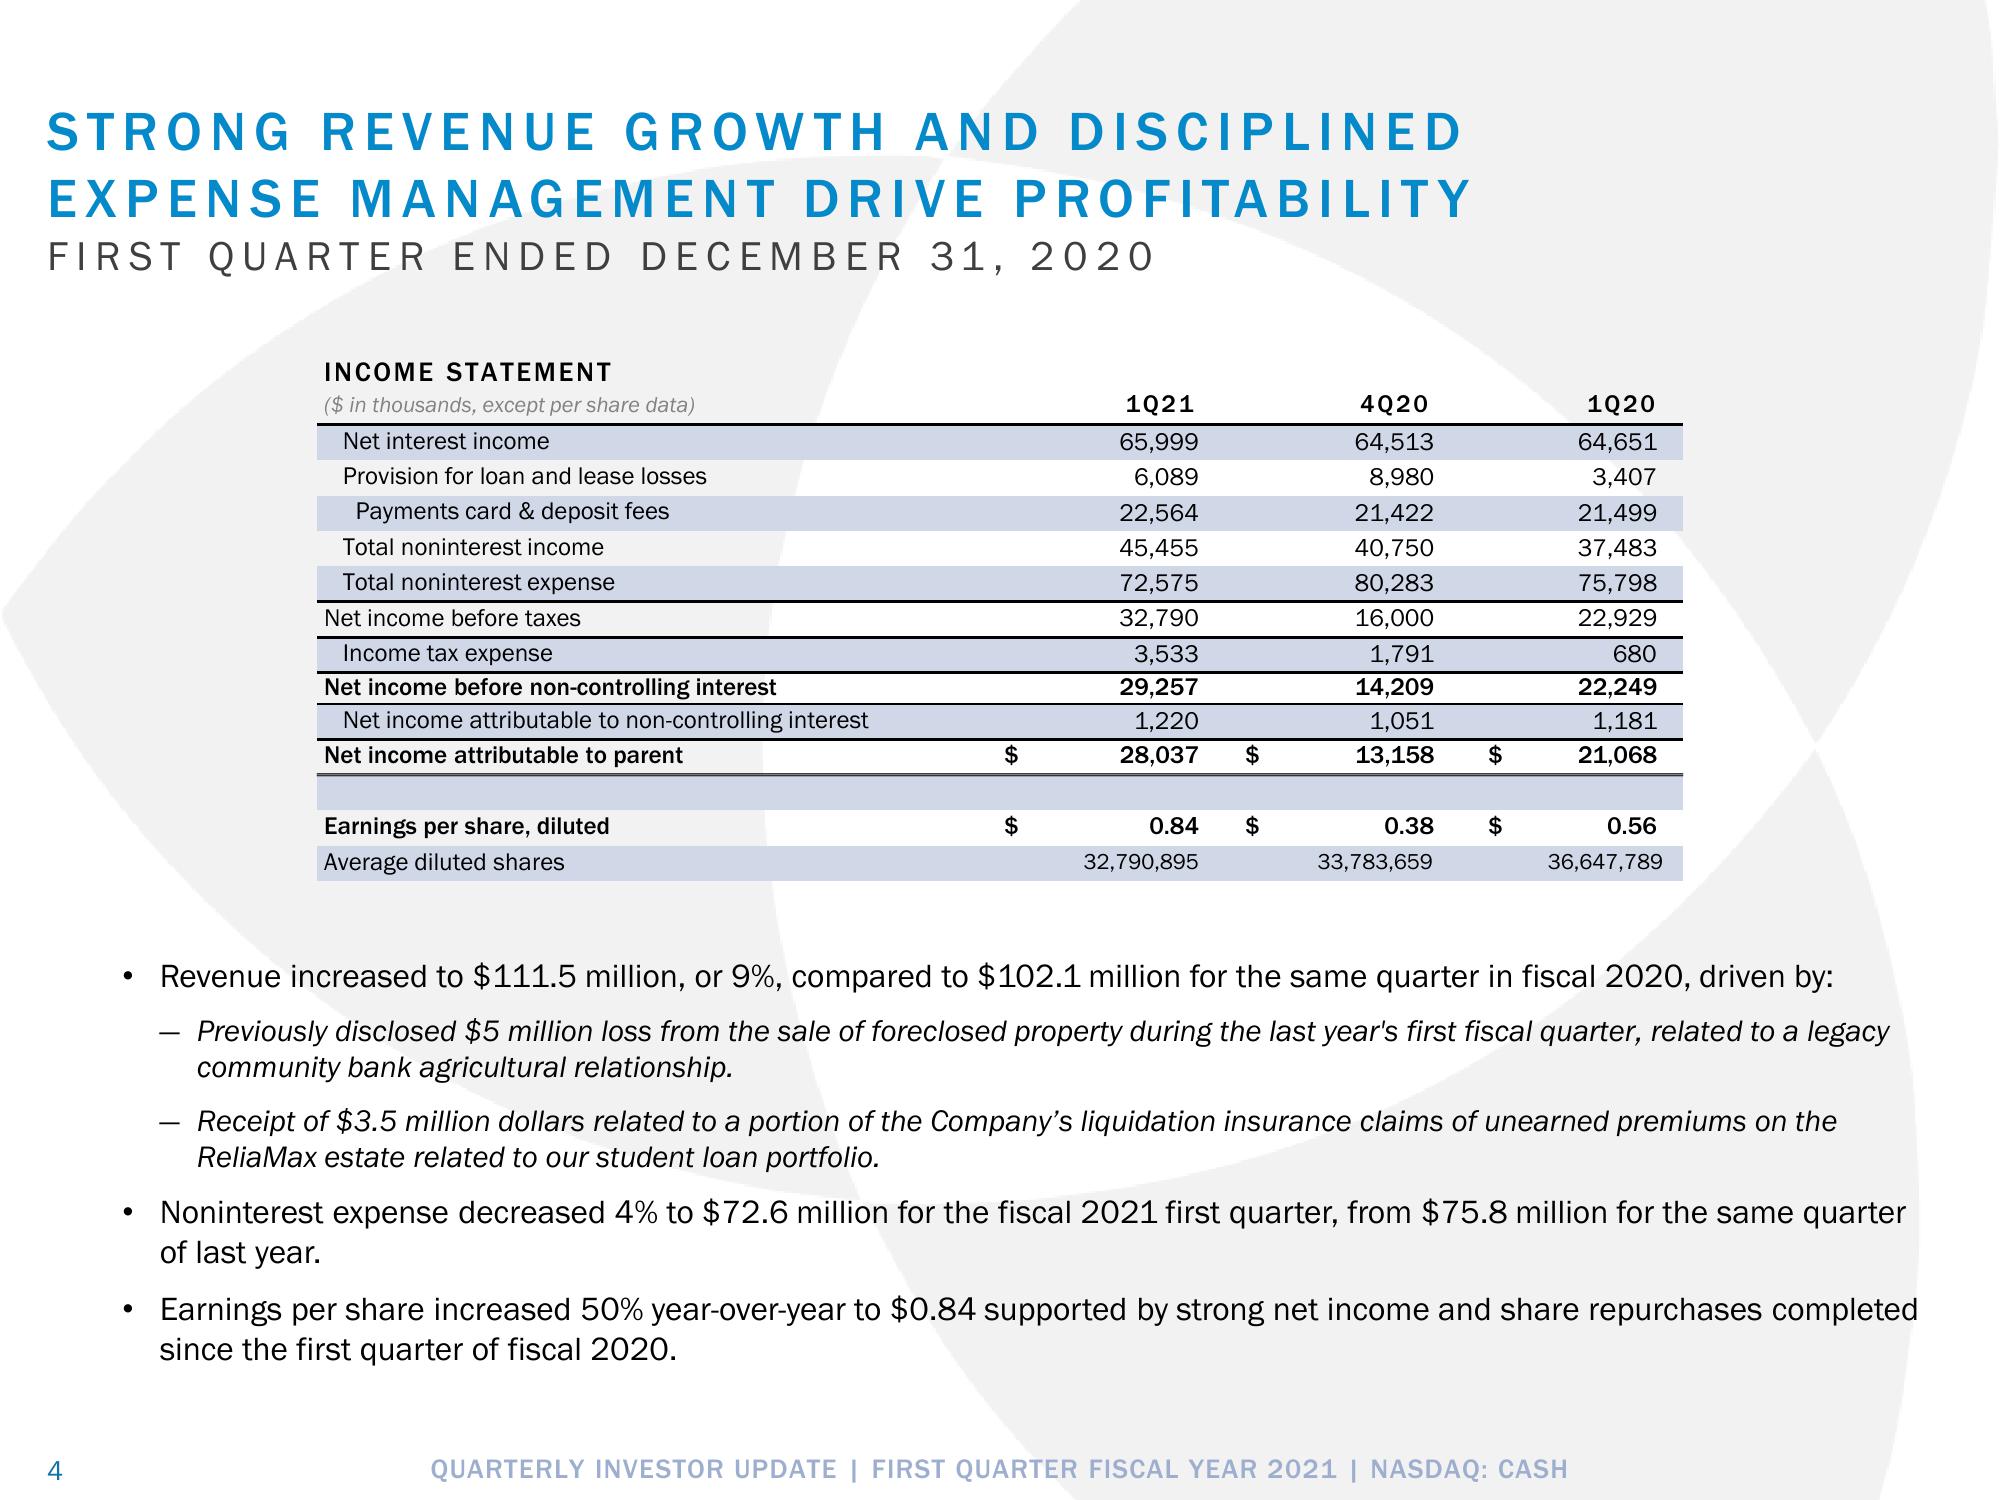
Revenue increased to $111.5 million, or 9%, compared to $102.1 million for the same quarter in fiscal 2020, driven by:
Previously disclosed $5 million loss from the sale of foreclosed property during the last year's first fiscal quarter, related to a legacy
community bank agricultural relationship.
Receipt of $3.5 million dollars related to a portion of the Company's liquidation insurance claims of unearned premiums on the
Relia Max estate related to our student loan portfolio.
Noninterest expense decreased 4% to $72.6 million for the fiscal 2021 first quarter, from $75.8 million for the same quarter
of last year.
Earnings per share increased 50% year-over-year to $0.84 supported by strong net income and share repurchases completed
since the first quarter of fiscal 2020.
QUARTERLY INVESTOR UPDATE | FIRST QUARTER FISCAL YEAR 2021 | NASDAQ: CASHView entire presentation