Sonos Results Presentation Deck
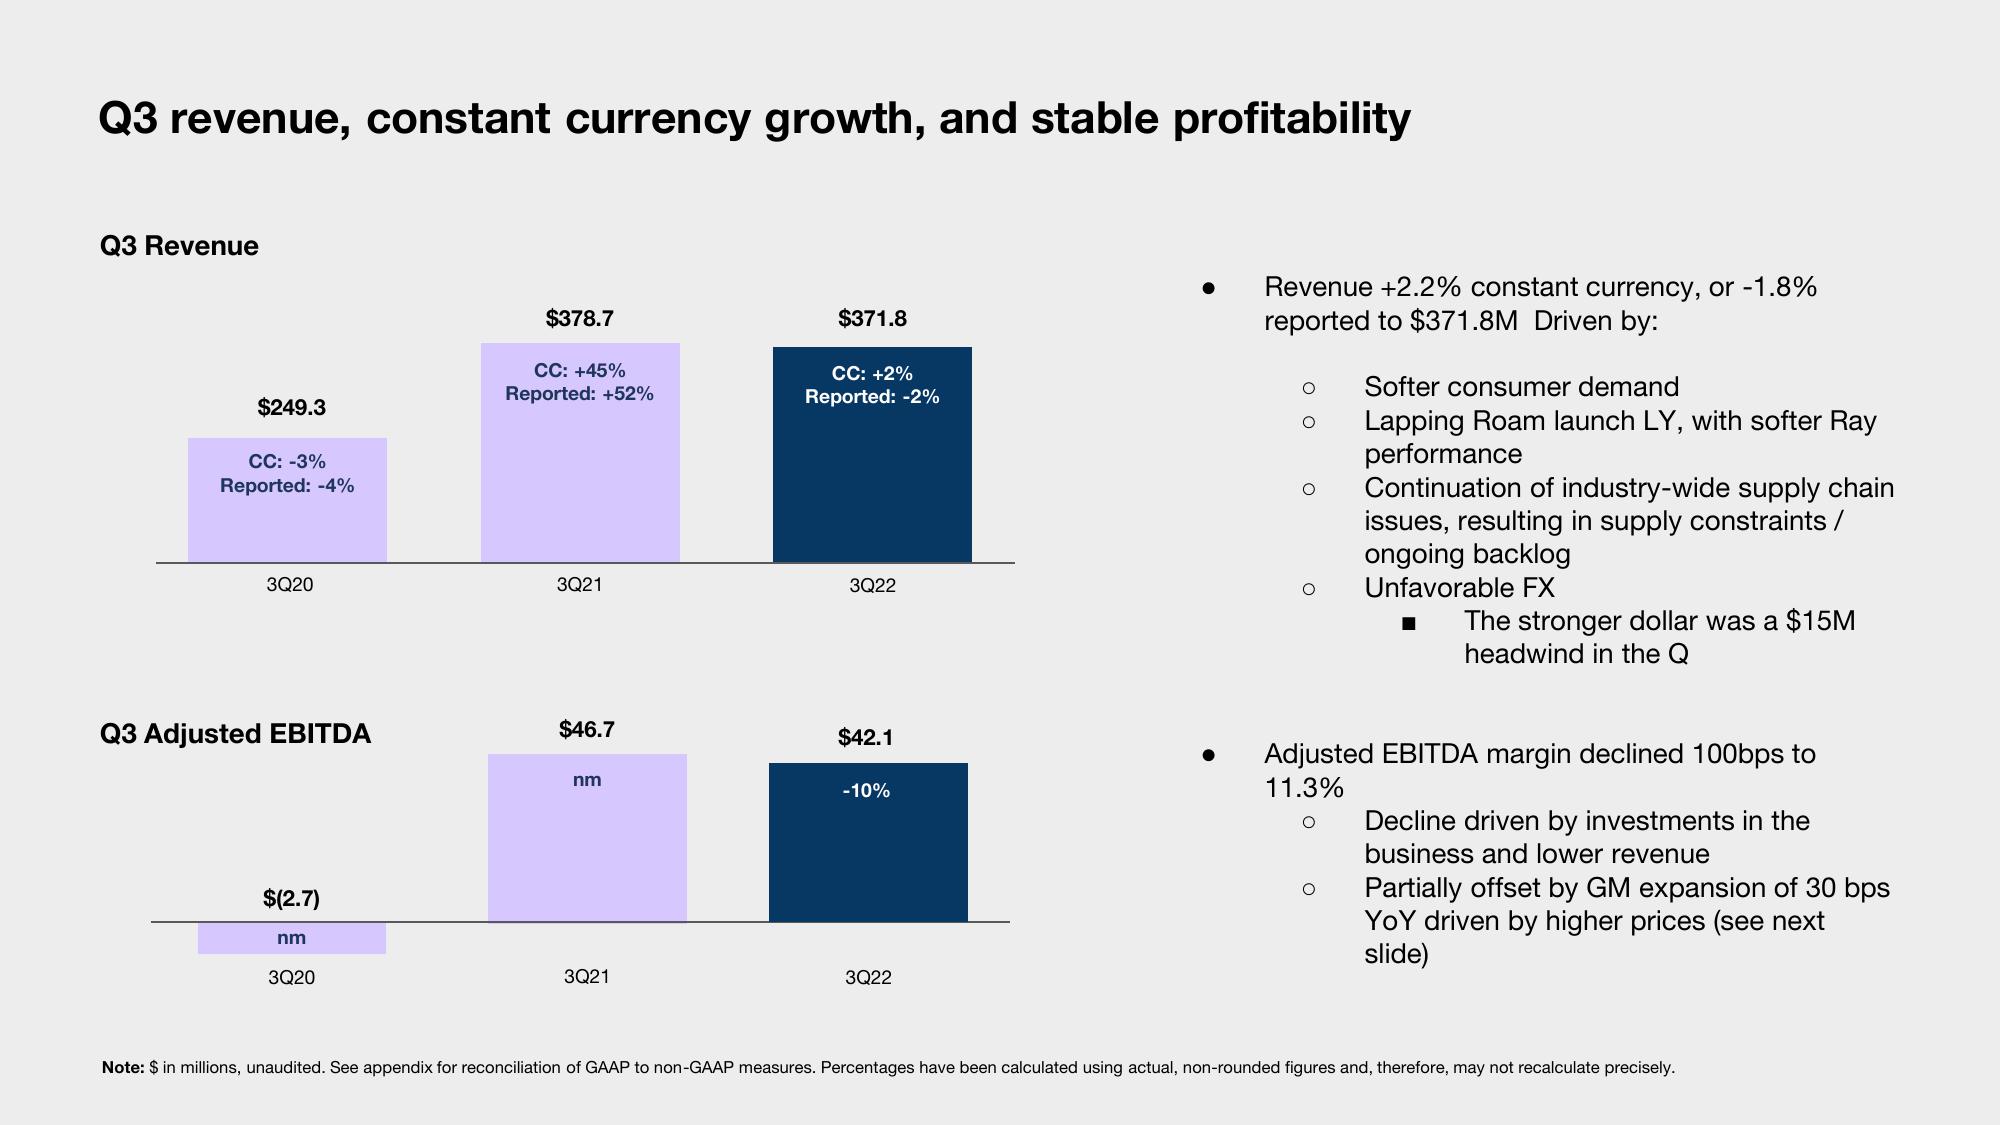
Q3 revenue, constant currency growth, and stable profitability
Q3 Revenue
$249.3
CC: -3%
Reported: -4%
3Q20
Q3 Adjusted EBITDA
$(2.7)
nm
3Q20
$378.7
CC: +45%
Reported: +52%
3Q21
$46.7
nm
3Q21
$371.8
CC: +2%
Reported: -2%
3Q22
$42.1
-10%
3Q22
Revenue +2.2% constant currency, or -1.8%
reported to $371.8M Driven by:
O
O
Softer consumer demand
Lapping Roam launch LY, with softer Ray
performance
Continuation of industry-wide supply chain
issues, resulting in supply constraints /
ongoing backlog
Unfavorable FX
The stronger dollar was a $15M
headwind in the Q
Adjusted EBITDA margin declined 100bps to
11.3%
Decline driven by investments in the
business and lower revenue
Partially offset by GM expansion of 30 bps
YoY driven by higher prices (see next
slide)
Note: $ in millions, unaudited. See appendix for reconciliation of GAAP to non-GAAP measures. Percentages have been calculated using actual, non-rounded figures and, therefore, may not recalculate precisely.View entire presentation