Main Street Capital Fixed Income Presentation Deck
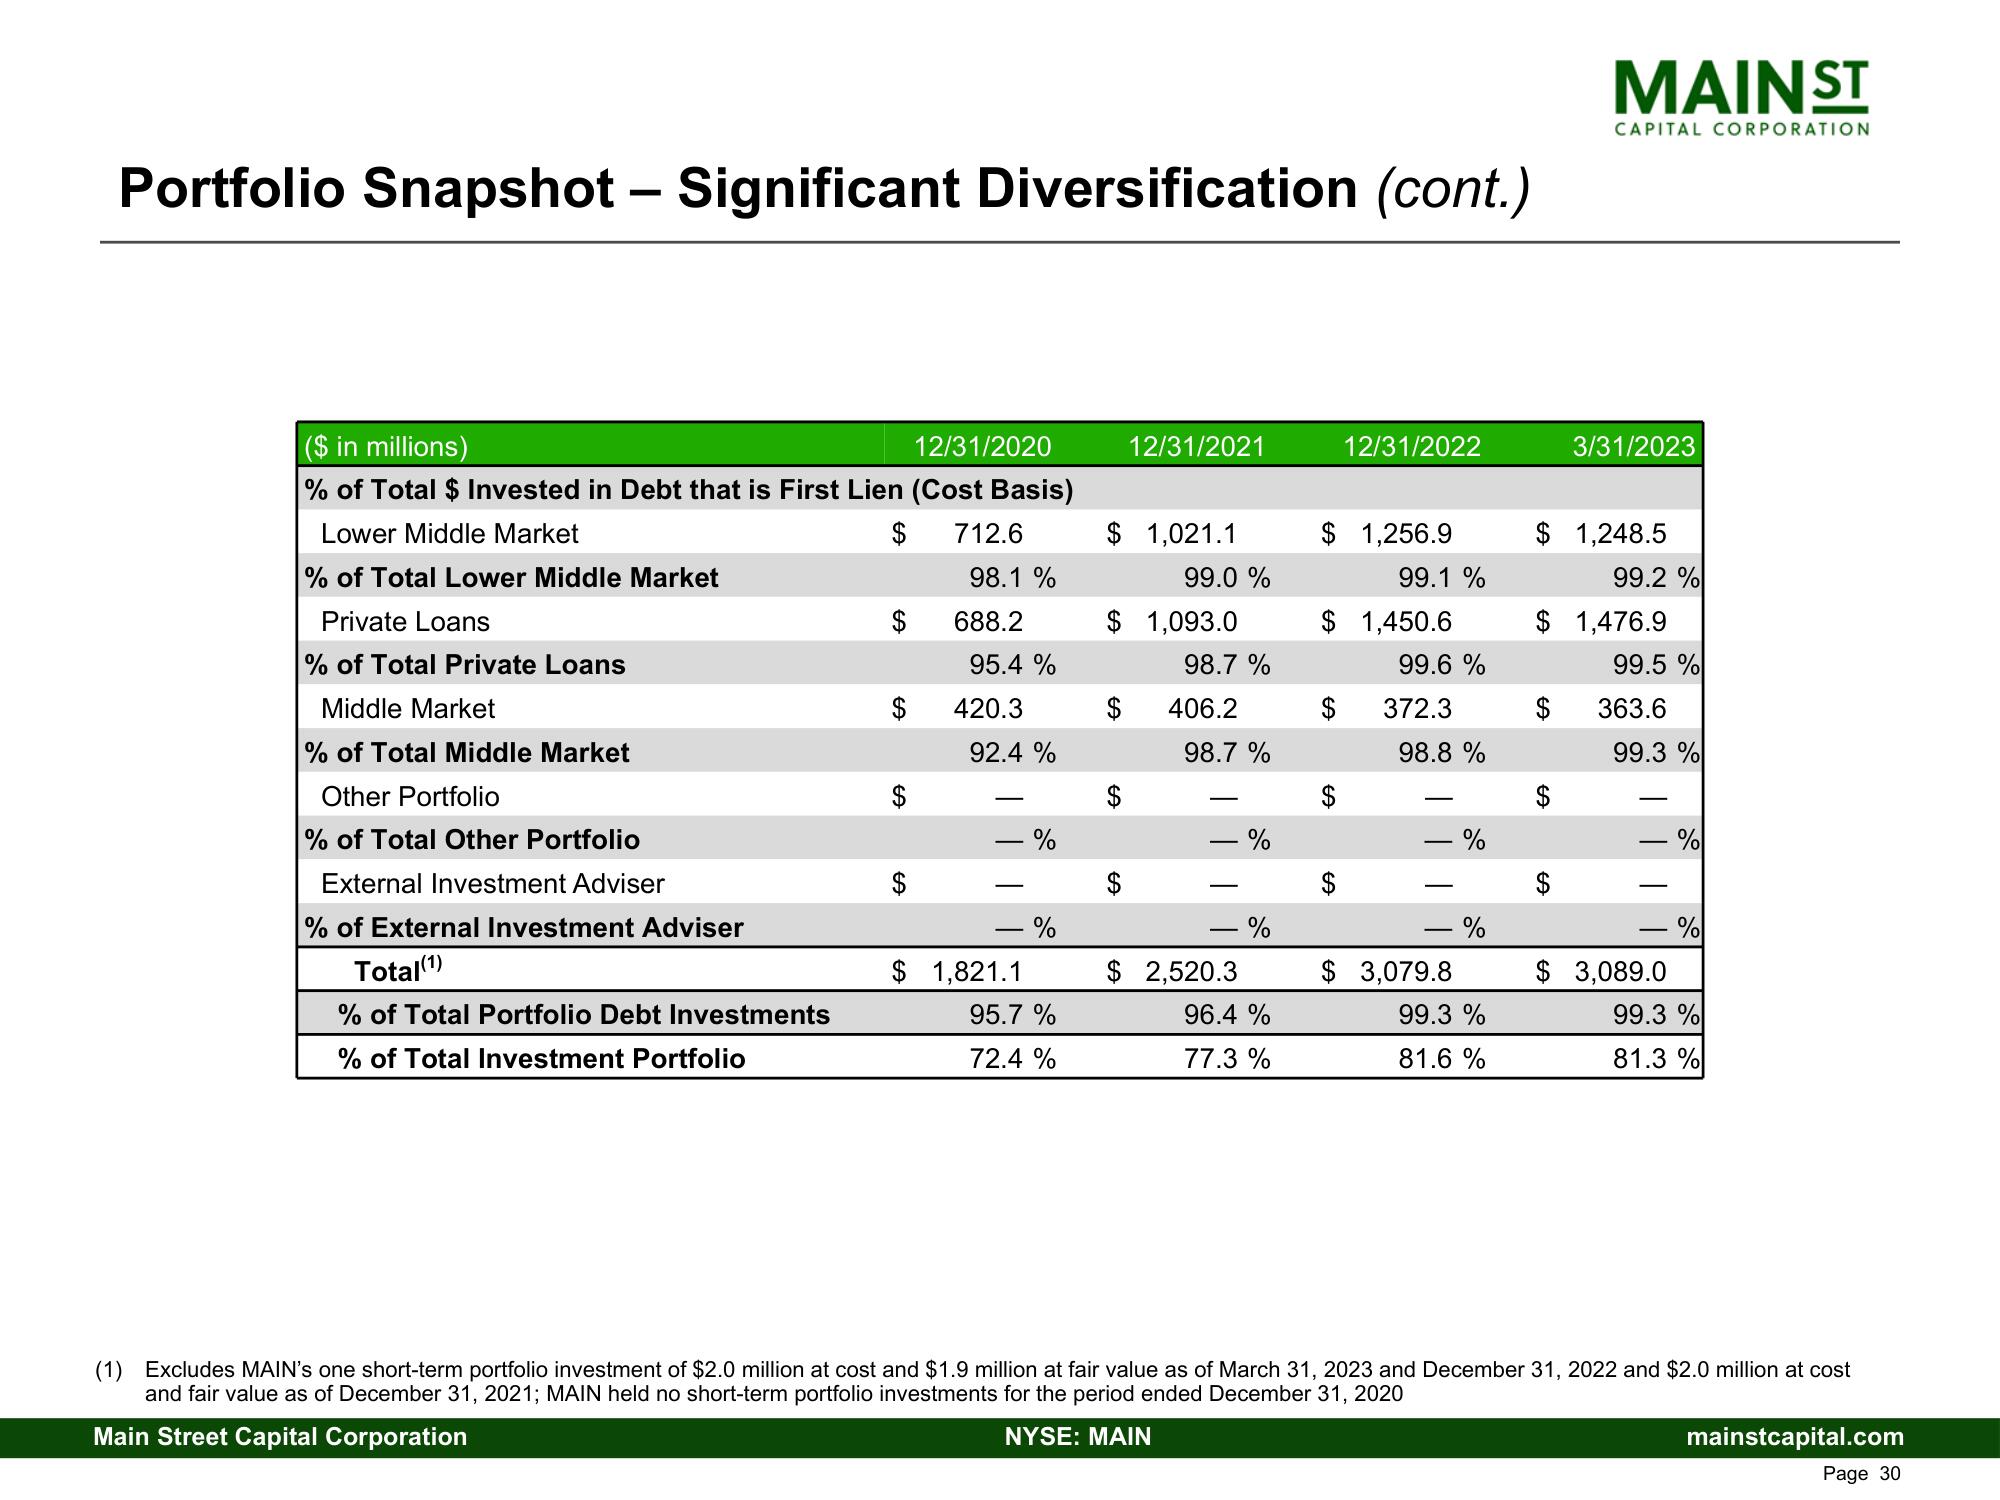
Portfolio Snapshot - Significant Diversification (cont.)
($ in millions)
12/31/2020
% of Total $ Invested in Debt that is First Lien (Cost Basis)
Lower Middle Market
% of Total Lower Middle Market
Private Loans
% of Total Private Loans
Middle Market
% of Total Middle Market
Other Portfolio
% of Total Other Portfolio
External Investment Adviser
% of External Investment Adviser
Total(1)
% of Total Portfolio Debt Investments
% of Total Investment Portfolio
$ 712.6
$
98.1 %
688.2
95.4 %
420.3
92.4 %
- %
$ 1,821.1
%
95.7 %
72.4 %
$ 1,021.1
12/31/2021
EA
$ 1,093.0
GA
99.0 %
98.7 %
406.2
98.7 %
- %
- %
$ 2,520.3
96.4 %
77.3 %
$1,256.9
SA
12/31/2022
$ 1,450.6
SA
$
99.1 %
99.6 %
372.3
98.8 %
$3,079.8
%
%
99.3 %
81.6 %
MAIN ST
CAPITAL CORPORATION
$ 1,248.5
$
3/31/2023
A
$ 1,476.9
99.2 %
99.5 %
363.6
99.3 %
- %
1
$ 3,089.0
%
99.3 %
81.3%
(1) Excludes MAIN's one short-term portfolio investment of $2.0 million at cost and $1.9 million at fair value as of March 31, 2023 and December 31, 2022 and $2.0 million at cost
and fair value as of December 31, 2021; MAIN held no short-term portfolio investments for the period ended December 31, 2020
Main Street Capital Corporation
NYSE: MAIN
mainstcapital.com
Page 30View entire presentation