AT&T Results Presentation Deck
1Q21 Financial Summary
$ in billions, except EPS
Adjusted EPS
Adj. Ol Margin
6
$0.84 $0.86
$42.8 $43.9
ÜÜ
20.2%
21.2%
1Q20 1Q21
Reported EPS
Adjustments:
Actuarial gain on benefit plans
Amortization of intangibles
Gain on spectrum transaction
Other adjustments, net
Adjusted EPS
Revenues
1Q20 1Q21
1Q20
$0.63
$0.23
($0.10)
$0.08
$0.84
Cash from Ops
Free Cash Flow
CAPEX
$8.9
$3.9
$9.9
$5.9
$5.0 $4.0
1Q20 1Q21
April 22, 2021/ © 2021 AT&T Intellectual Property - AT&T Proprietary
1Q21
$1.04
($0.30)
$0.12
$0.86
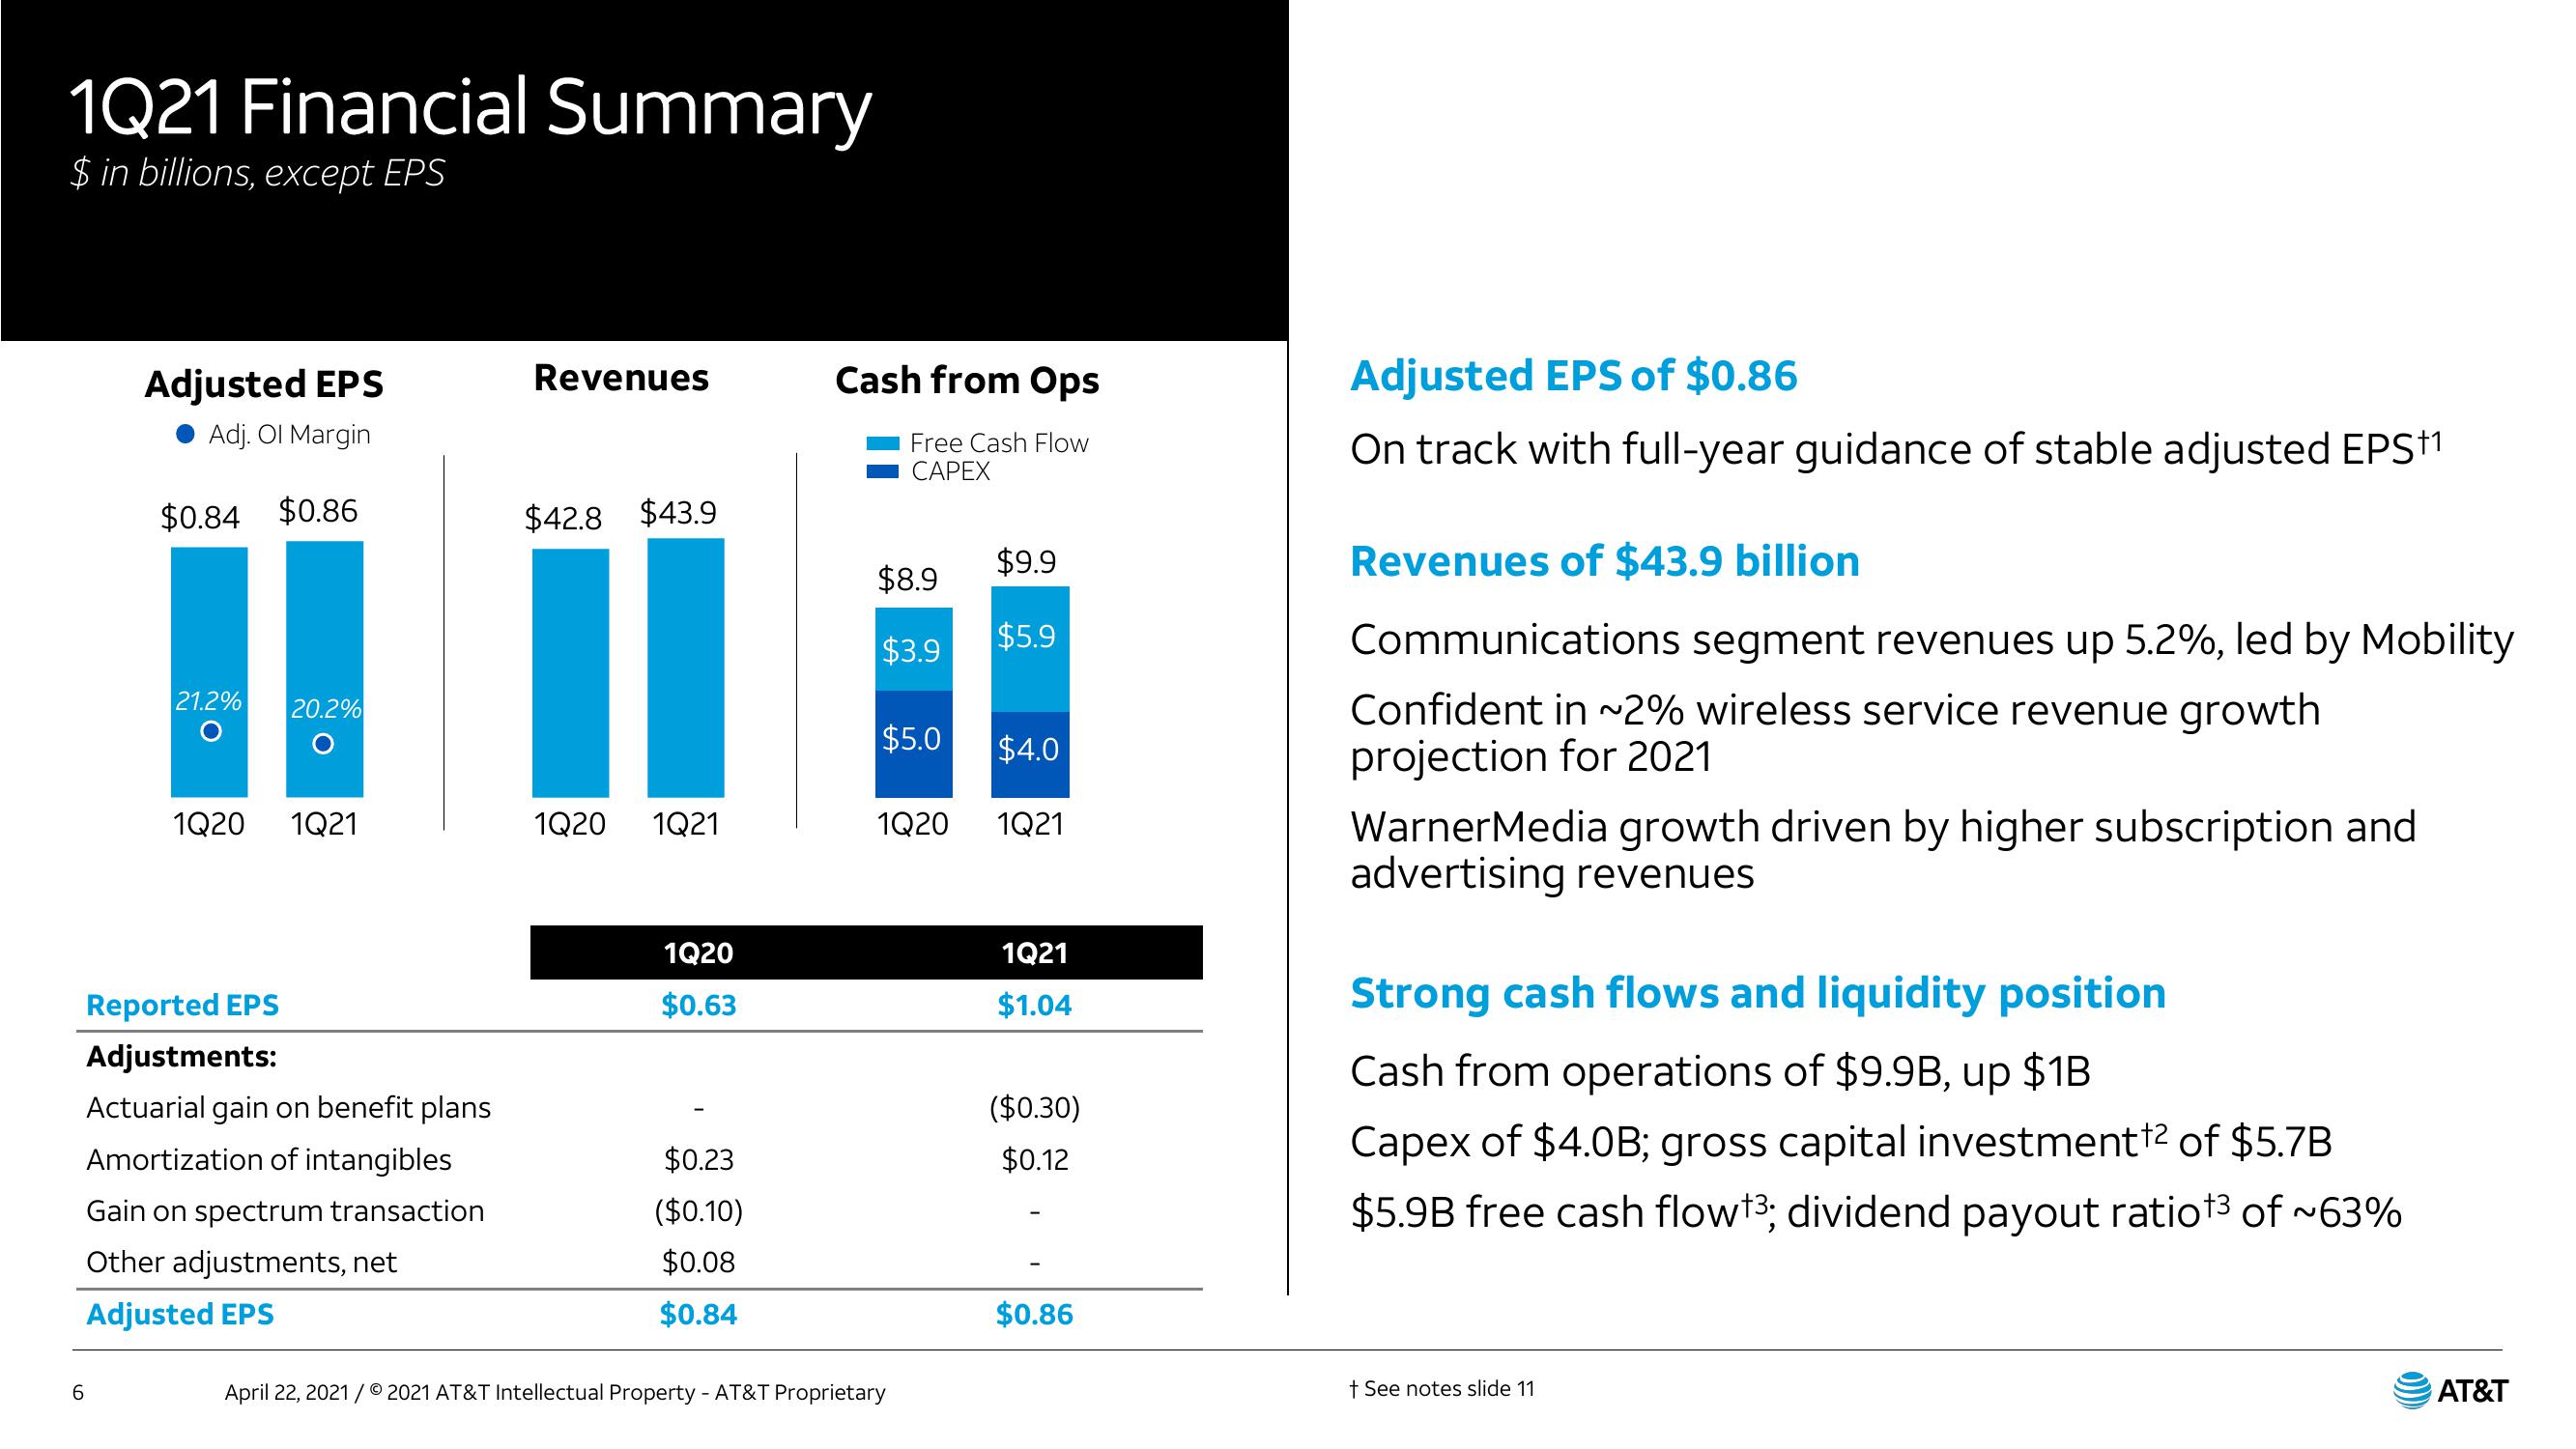
Adjusted EPS of $0.86
On track with full-year guidance of stable adjusted EPS+1
Revenues of $43.9 billion
Communications segment revenues up 5.2%, led by Mobility
Confident in ~2% wireless service revenue growth
projection for 2021
WarnerMedia growth driven by higher subscription and
advertising revenues
Strong cash flows and liquidity position
Cash from operations of $9.9B, up $1B
Capex of $4.0B; gross capital investment ¹2 of $5.7B
$5.9B free cash flow+³; dividend payout ratio¹³ of ~63%
+ See notes slide 11
AT&TView entire presentation