The Global Solar Photovoltaic Supply Chain and Bottom-UP Cost Model Results
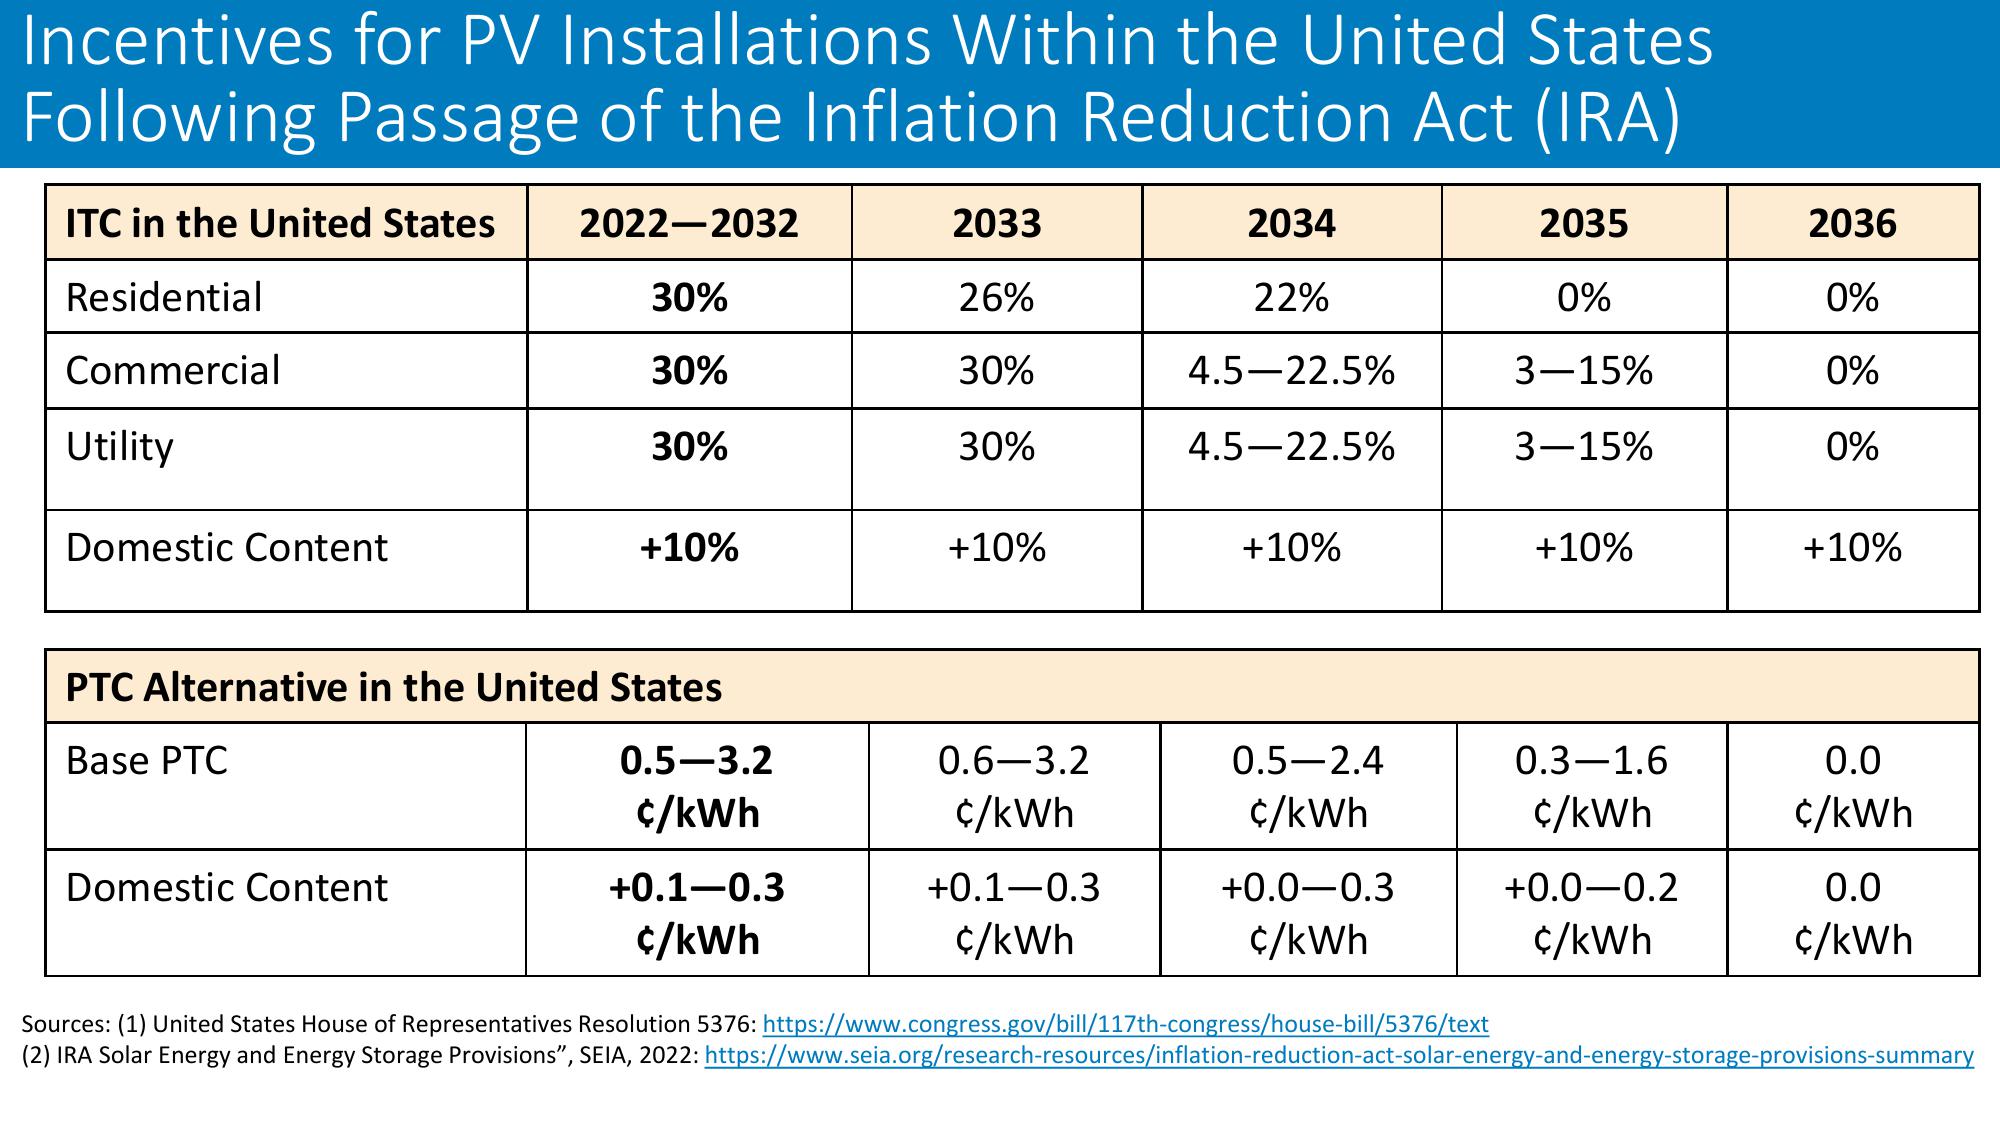
Incentives for PV Installations Within the United States
Following Passage of the Inflation Reduction Act (IRA)
ITC in the United States
2022-2032
2033
2034
2035
2036
Residential
30%
26%
22%
0%
0%
Commercial
30%
30%
4.5-22.5%
3-15%
0%
Utility
30%
30%
4.5-22.5%
3-15%
0%
Domestic Content
+10%
+10%
+10%
+10%
+10%
PTC Alternative in the United States
Base PTC
0.5-3.2
c/kWh
Domestic Content
+0.1-0.3
c/kWh
0.6-3.2
c/kWh
+0.1-0.3
c/kWh
0.5-2.4
c/kWh
+0.0-0.3
0.3-1.6
c/kWh
+0.0-0.2
0.0
c/kWh
0.0
c/kWh
c/kWh
c/kWh
Sources: (1) United States House of Representatives Resolution 5376: https://www.congress.gov/bill/117th-congress/house-bill/5376/text
(2) IRA Solar Energy and Energy Storage Provisions", SEIA, 2022: https://www.seia.org/research-resources/inflation-reduction-act-solar-energy-and-energy-storage-provisions-summaryView entire presentation