Cyxtera SPAC Presentation Deck
Capitalization
($ in mm)
Cash and Cash Equivalents
$150mm Revolver (Maturing 5/2022)
1st Lien Debt (Maturing 5/2024)
2nd Lien Debt (Maturing 5/2025)
Capital Leases
Total Debt
Net Debt (¹)
Less: Optional renewal portion of Capital Leases
Contractual Net Debt (Excl. Optional Capital Leases)
Less: Contractually obligated Capital Leases
Less: Equipment Leases
Financial Net Debt (Excl. All Capital Leases)
Key Credit Metrics
2020E Adj. EBITDA / Net Leverage (4)
2020E Adj. EBITDA/ Contractual Net Leverage (5)
2020E Adj. EBITDA / Financial Net Leverage (6)
Total Liquidity
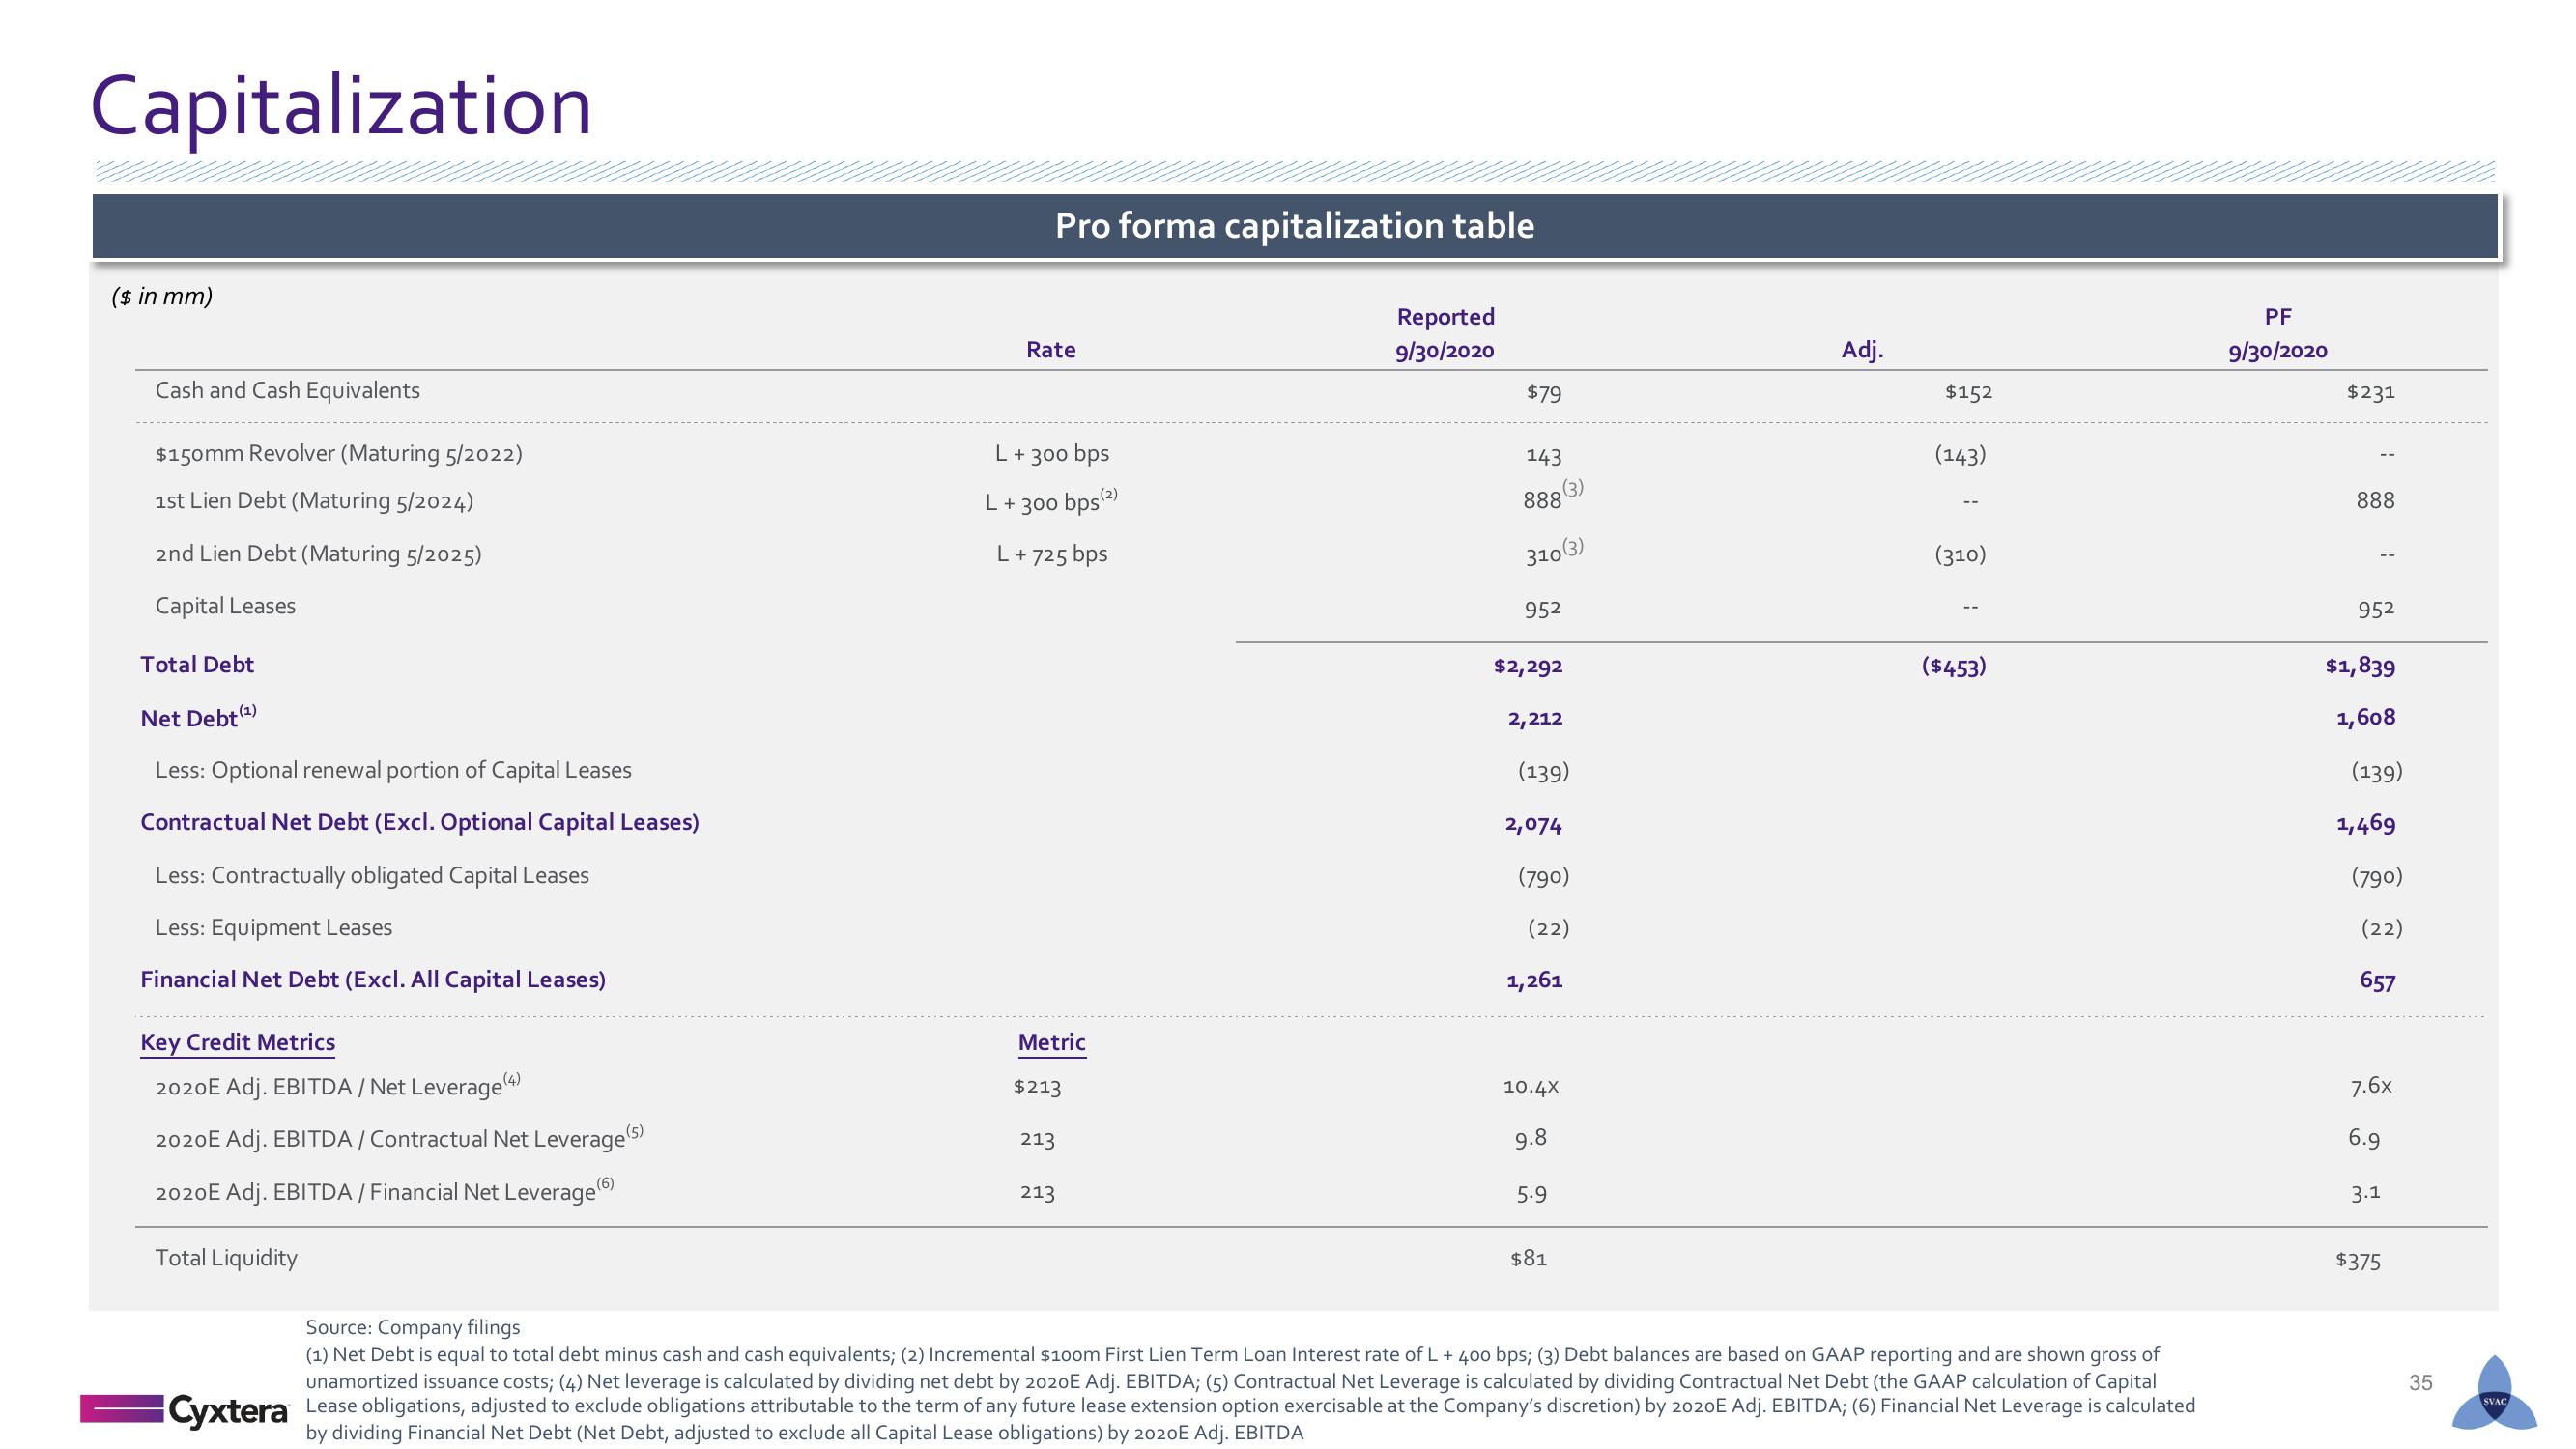
Pro forma capitalization table
Rate
L + 300 bps
L + 300 bps(2)
L + 725 bps
Metric
$213
213
213
Reported
9/30/2020
$79
143
888
310 (3)
952
$2,292
2,212
(139)
2,074
(3)
(790)
(22)
1,261
10.4x
9.8
5.9
$81
Adj.
$152
(143)
(310)
($453)
Source: Company filings
(1) Net Debt is equal to total debt minus cash and cash equivalents; (2) Incremental $100m First Lien Term Loan Interest rate of L + 400 bps; (3) Debt balances are based on GAAP reporting and are shown gross of
unamortized issuance costs; (4) Net leverage is calculated by dividing net debt by 2020E Adj. EBITDA; (5) Contractual Net Leverage is calculated by dividing Contractual Net Debt (the GAAP calculation of Capital
Cyxtera Lease obligations, adjusted to exclude obligations attributable to the term of any future lease extension option exercisable at the Company's discretion) by 2020E Adj. EBITDA; (6) Financial Net Leverage is calculated
by dividing Financial Net Debt (Net Debt, adjusted to exclude all Capital Lease obligations) by 2020E Adj. EBITDA
PF
9/30/2020
$231
888
952
$1,839
1,608
(139)
1,469
(790)
(22)
657
7.6x
6.9
3.1
$375
35
SVACView entire presentation