Kinnevik Results Presentation Deck
Intro
Net Asset Value
SOFTWARE
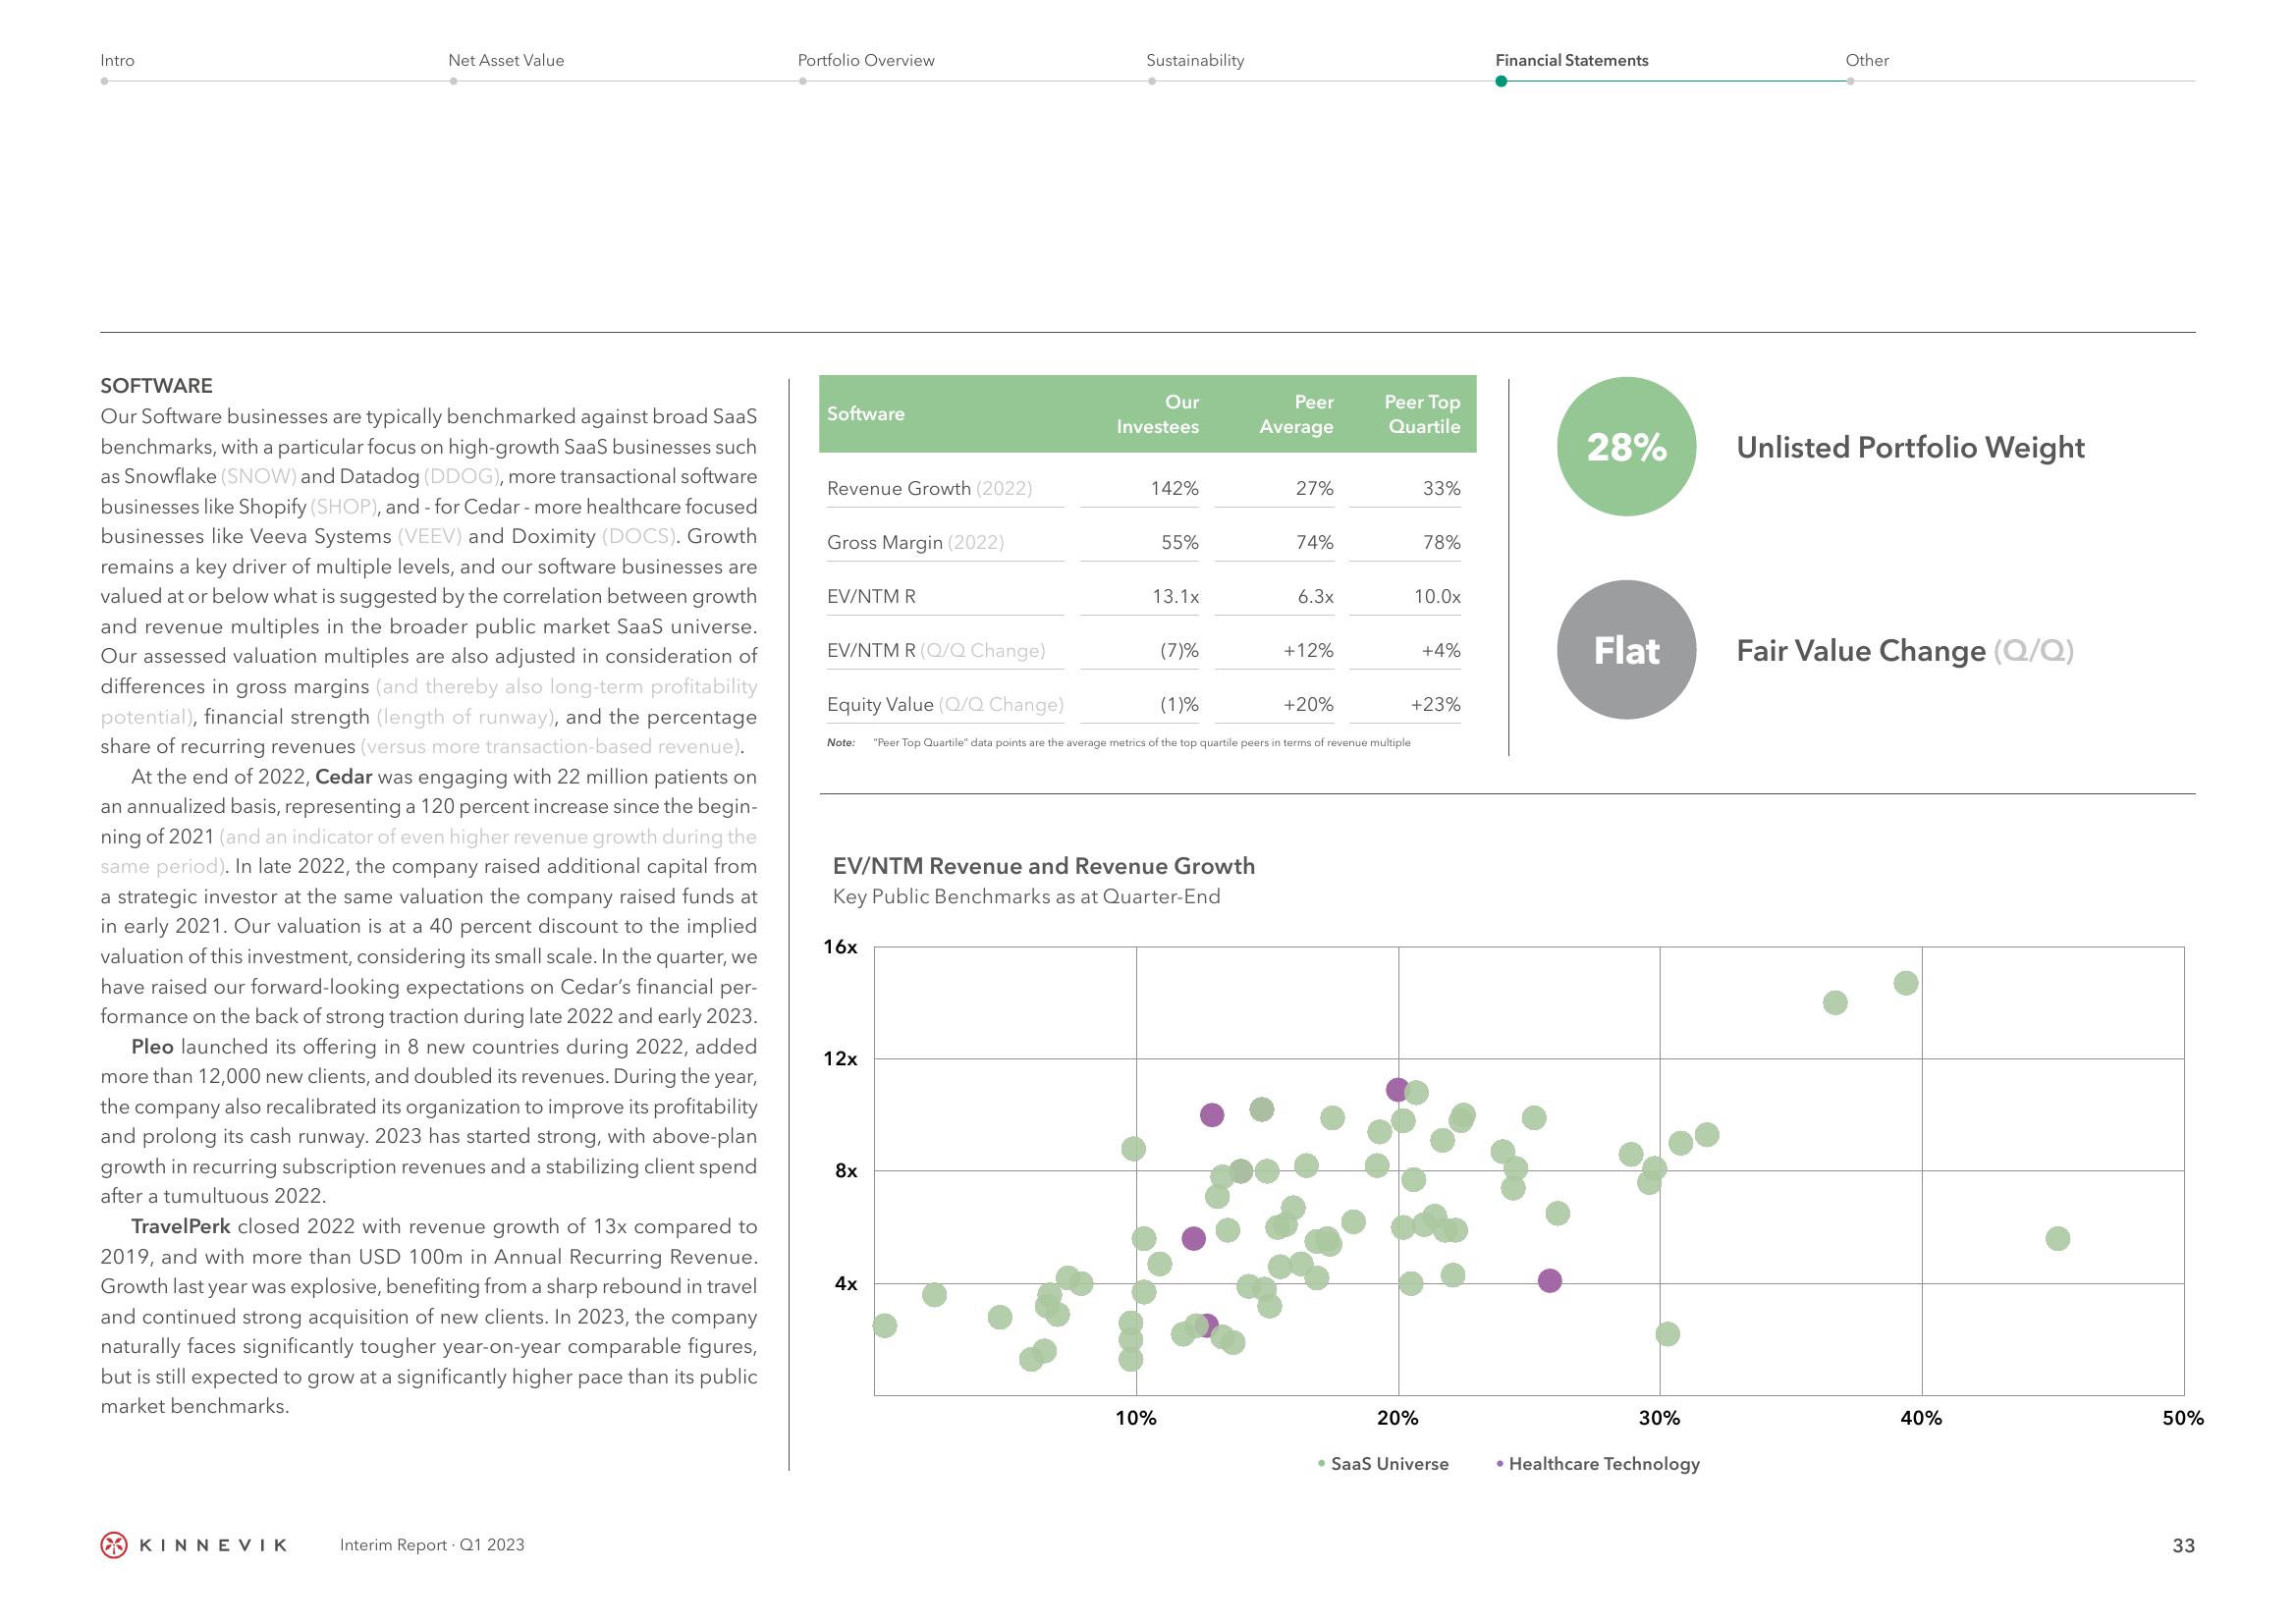
Our Software businesses are typically benchmarked against broad SaaS
benchmarks, with a particular focus on high-growth SaaS businesses such
as Snowflake (SNOW) and Datadog (DDOG), more transactional software
businesses like Shopify (SHOP), and - for Cedar - more healthcare focused
businesses like Veeva Systems (VEEV) and Doximity (DOCS). Growth
remains a key driver of multiple levels, and our software businesses are
valued at or below what is suggested by the correlation between growth
and revenue multiples in the broader public market SaaS universe.
Our assessed valuation multiples are also adjusted in consideration of
differences in gross margins (and thereby also long-term profitability
potential), financial strength (length of runway), and the percentage
share of recurring revenues (versus more transaction-based revenue).
At the end of 2022, Cedar was engaging with 22 million patients on
an annualized basis, representing a 120 percent increase since the begin-
ning of 2021 (and an indicator of even higher revenue growth during the
same period). In late 2022, the company raised additional capital from
a strategic investor at the same valuation the company raised funds at
in early 2021. Our valuation is at a 40 percent discount to the implied
valuation of this investment, considering its small scale. In the quarter, we
have raised our forward-looking expectations on Cedar's financial per-
formance on the back of strong traction during late 2022 and early 2023.
Pleo launched its offering in 8 new countries during 2022, added
more than 12,000 new clients, and doubled its revenues. During the year,
the company also recalibrated its organization to improve its profitability
and prolong its cash runway. 2023 has started strong, with above-plan
growth in recurring subscription revenues and a stabilizing client spend
after a tumultuous 2022.
TravelPerk closed 2022 with revenue growth of 13x compared to
2019, and with more than USD 100m in Annual Recurring Revenue.
Growth last year was explosive, benefiting from a sharp rebound in travel
and continued strong acquisition of new clients. In 2023, the company
naturally faces significantly tougher year-on-year comparable figures,
but is still expected to grow at a significantly higher pace than its public
market benchmarks.
KINNEVIK
Interim Report Q1 2023
Portfolio Overview
Software
Revenue Growth (2022)
Gross Margin (2022)
EV/NTM R
EV/NTM R (Q/Q Change)
Equity Value (Q/Q Change)
Note:
16x
12x
8x
Sustainability
4x
Our
Investees
142%
55%
13.1x
EV/NTM Revenue and Revenue Growth
Key Public Benchmarks as at Quarter-End
(7)%
10%
(1)%
Peer
Average
27%
74%
6.3x
+12%
+20%
"Peer Top Quartile" data points are the average metrics of the top quartile peers in terms of revenue multiple
Peer Top
Quartile
33%
78%
10.0x
20%
+4%
+23%
• SaaS Universe
Financial Statements
28%
Flat
30%
• Healthcare Technology
Other
Unlisted Portfolio Weight
Fair Value Change (Q/Q)
A
40%
50%
33View entire presentation